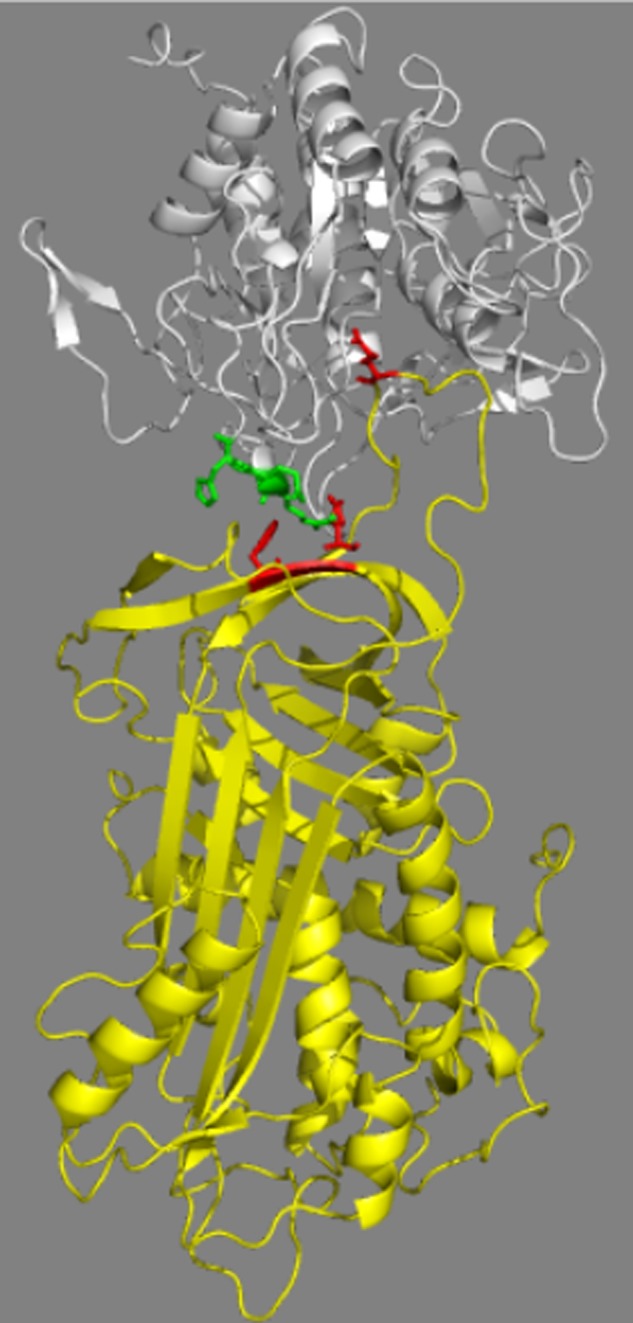
FIGURE 8.

Molecular model of the serpin B8-furin Michaelis complex. The complex is depicted as ribbon structures with serpin B8 in yellow and the furin catalytic domain in white. Highlighted in stick are the furin(298–300) loop residues (green), serpin B8 residues Phe198 and Glu200 of strand 3 of β-sheet C (red), and the serpin B8 P1 residue (red). The complex shown was modeled based on the antithrombin-S195A factor Xa Michaelis complex structure but modeling based on two other Michaelis complex structures gave similar results (see “Experimental Procedures”). The proximity of the furin loop and the strand 3C exosite residues is evident. The figure was prepared using PyMol software.
