FIGURE 2.
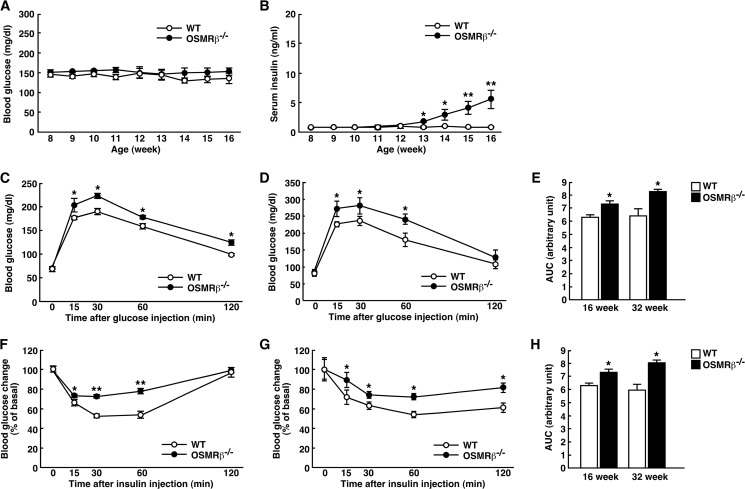
Glucose intolerance and insulin resistance in OSMRβ−/− mice under normal diet conditions. A and B, shown are blood glucose (A) and serum insulin (B) levels in WT and OSMRβ−/− mice from 8 to 16 weeks of age (n = 6). C–H, shown are the results of the ipGTTs (C and D) and ITTs (F and G) in WT and OSMRβ−/− mice at 16 (C and F) and 32 (D and G) weeks of age (n = 6). The areas under the curves (AUC) for blood glucose in the ipGTTs (E) and ITTs (H) are shown. The data represent the mean ± S.E. *, p < 0.05; **, p < 0.01 WT versus OSMRβ−/− mice, ANOVA followed by the post-hoc Bonferroni test (A–D, F, and G); Student's t test (E and H).

