FIGURE 5.
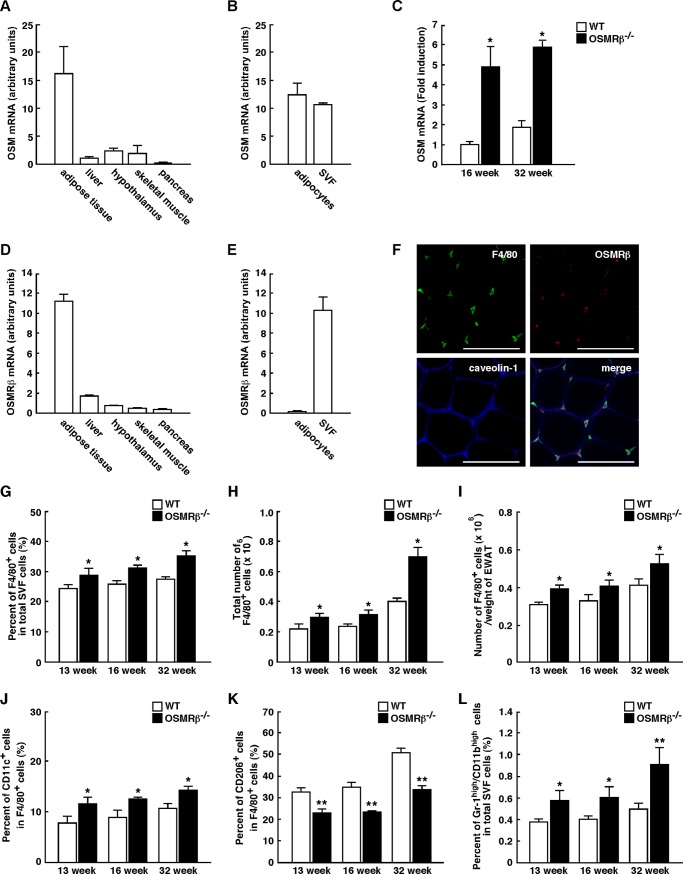
Phenotypes of ATMs in WT and OSMRβ−/− mice under normal diet conditions. A–F, shown is expression of OSM and OSMRβ in the adipose tissue. A, shown is the mRNA expression of OSM in various tissues of C57BL/6J mice (n = 6). B, shown is mRNA expression of OSM in the SVF and adipocyte fraction in the adipose tissue of C57BL/6J mice (n = 6). C, shown is mRNA expression of OSM in the adipose tissue of WT and OSMRβ−/− mice at 16 and 32 weeks of age (n = 6). D, shown is mRNA expression of OSMRβ in various tissues of C57BL/6J mice (n = 6). E, shown is mRNA expression of OSMRβ in the SVF and adipocyte fraction in the adipose tissue of C57BL/6J mice (n = 6). F, shown is immunofluorescence staining for OSMRβ (red) with F4/80 (green) and caveolin-1 (blue) in the adipose tissue of C57BL/6J mice. Scale bars = 100 μm. G–I, shown are the percentages (G) and total numbers (H) of F4/80-positive cells among the total numbers of cells in the SVF of the epididymal fat pads in WT and OSMRβ−/− mice at 13, 16, and 32 weeks of age (n = 4–6). The total numbers of macrophages were normalized by the weights of the epididymal fat pads (I). J and K, shown are the percentages of CD11c-positive (J) and CD206-positive (K) cells in the F4/80-positive cells of WT and OSMRβ−/− mice at 13, 16, and 32 weeks of age (n = 4–6). L, shown are the percentages of neutrophils (Gr-1high/CD11bhigh cells) in the total cells in the SVF of WT and OSMRβ−/− mice at 13, 16, and 32 weeks of age (n = 4–6). The data represent the mean ± S.E. *, p < 0.05; **, p < 0.01 WT versus OSMRβ−/− mice, Student's t test.

