
FIGURE 6.
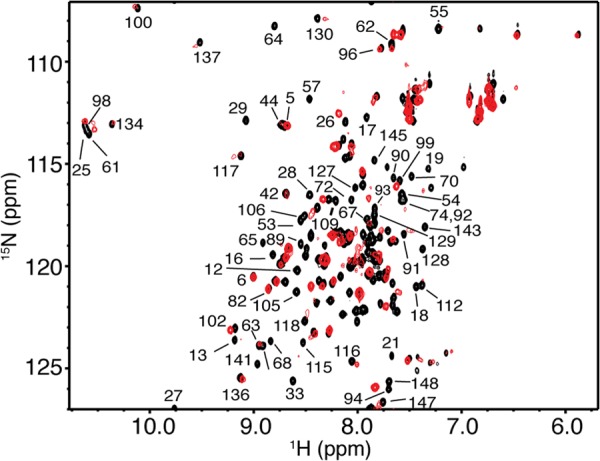
Overlay of two-dimensional 1H,15N HSQC spectra obtained for 15N-labeled CaM in the free state (black) and in complex with unlabeled Fasm at saturation (0.5:1 Fasm:CaM, red). No changes were observed in the HSQC spectrum with further addition of Fasm, indicating saturation at this molar ratio. Data are consistent with formation of a 2:1 CaM:Fasm complex.