
FIGURE 8.
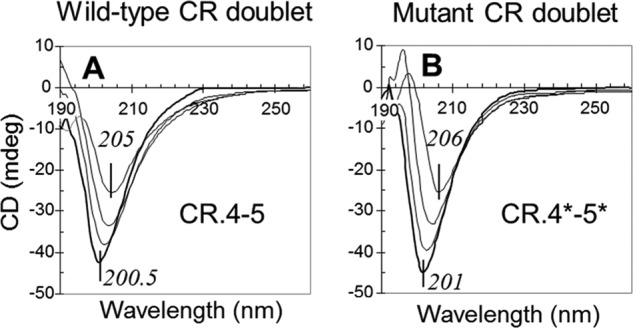
Far-UV CD spectra of CR.4-5 and its mutant upon the titration by EDTA. CR.4-5 (A) and CR.4-5 W144S/W193S (B) were taken at concentrations of 30 μm. The spectra correspond to the absence of EDTA (bottom curves in bold) and its increase as 1×, 2×, and 3× over molar equivalent of Ca2+ in the solutions, shown as respective increase in the signals (upper curves). mdeg, millidegrees.