FIGURE 6.

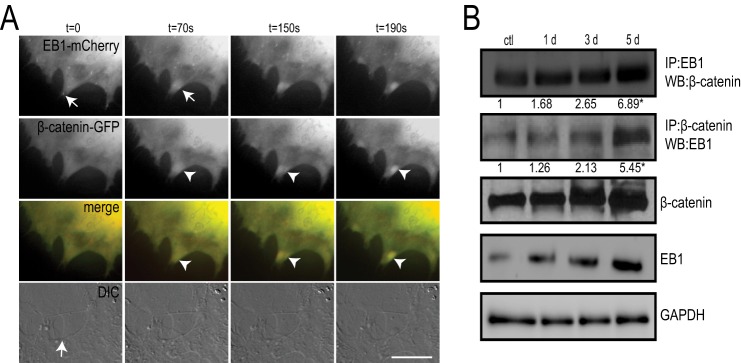
EB1 associates with β-catenin. A, live cell epifluorescent imaging of MC3T3-E1 cells co-transfected with β-catenin-GFP and EB1-mCherry. Panels show targeting of EB1-mCherry comets (arrows) into cortical regions at the site of cell-cell contacts (arrow in differential interference contrast (DIC) still image). Accumulation of β-catenin-GFP (arrowheads) occurs shortly after EB1-mCherry targeting to the cell periphery. Time is indicated in seconds. Scale bar, 10 μm. B, immunoprecipitation with EB1 or β-catenin antibodies reveals an interaction between EB1 and β-catenin that increases with osteoblast differentiation. MC3T3-E1 cells were stimulated with AA for 1, 3, and 5 days, and lysates were prepared and subjected to SDS-PAGE followed by immunoblot analysis for reciprocal antibodies, as indicated. Densitometry analysis was performed on the resulting bands from three independent experiments, and the mean precipitated protein levels are numerically presented as -fold increases relative to control treatments. Western blots are also shown of total cell lysates collected for the immunoprecipitations. GAPDH was used as a loading control. Experiments were repeated three times with similar results.
