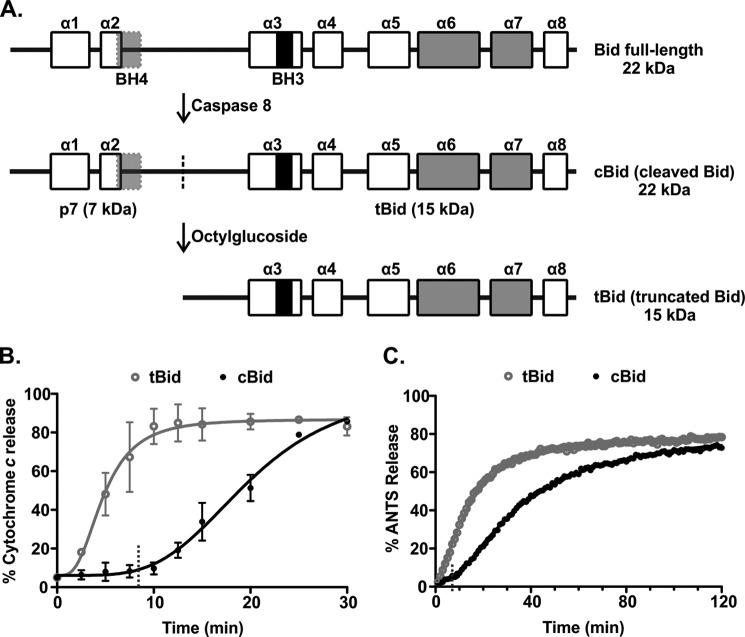
FIGURE 1.
There is a pronounced lag phase in membrane permeabilization by Bax when cBid is used as the activator. A, shown is a schematic outlining the preparation of different forms of Bid. Full-length Bid was first subjected to cleavage by caspase 8 to obtain cBid (cleaved Bid). The cleavage site is indicated with a dotted line. Although cleaved, the two fragments of Bid remain in a complex due to strong hydrophobic interactions. To isolate the active, membrane binding tBid fragment (truncated Bid), cBid is treated with octylglucoside to remove the p7 fragment. The BH3 region (black), BH4 region (light gray), and the membrane binding helices (gray) are shown. The boxes indicate the individual α-helices (numbered α symbols above). B, shown is cytochrome c release from mitochondria isolated from bak−/− mice. Mitochondria (1 mg/ml) were incubated with 1 nm tBid (gray, open circles) or cBid (black, closed circles) and with 50 nm Bax. Cytochrome c release was quantified by immunoblotting the bound protein in the pellet and the free protein in the supernatant at the indicated times. The data (circles) are fit with a delayed single exponential function (line), (mean ± S.E., n = 3). Dashed lines indicate the value of the lag time obtained from the fit. C, permeabilization of liposomes encapsulating ANTS and DPX by incubation with 20 nm tBid (gray, open circles) or cBid (black, closed circles) and 100 nm Bax is shown. The increase in the fluorescence intensity of ANTS over time is due to membrane permeabilization of the liposomes. One representative series of measurements from three independent experiments is shown. The data (circles) are fit with a function accounting for a lag phase followed by a single exponential function (line). Dashed lines indicate the value of the lag time obtained from the fit.

