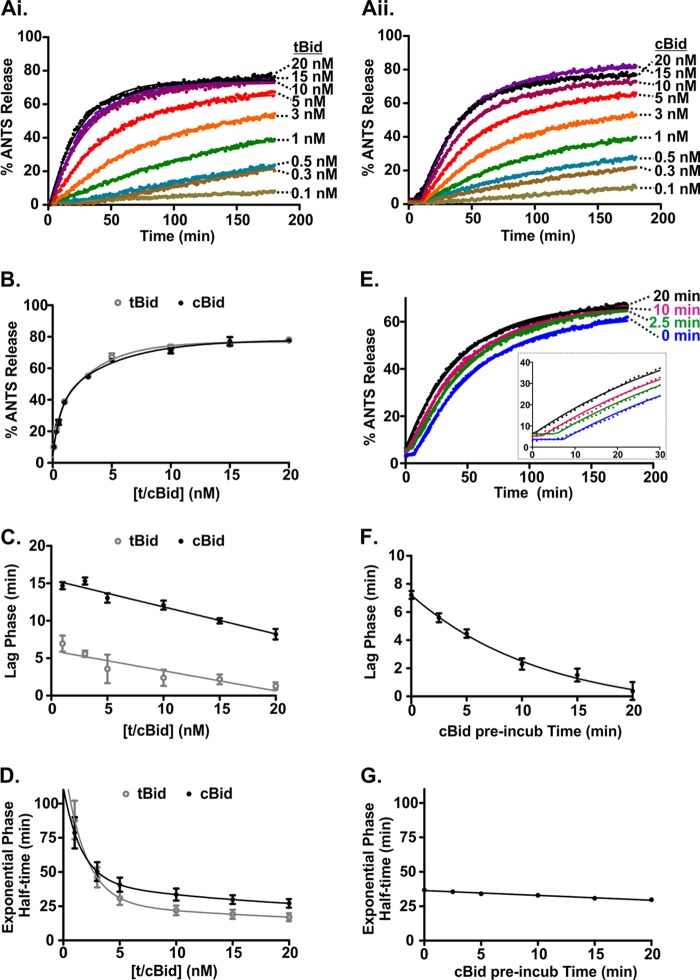
FIGURE 3.
The lag in membrane permeabilization is due to slow activation of cBid at the membrane. A, ANTS release was observed when adding varying concentrations of (i) tBid or (ii) cBid to 0.5 nm liposomes containing ANTS/DPX and 100 nm Bax. One representative series of measurements from three independent experiments is shown. Solid lines are fit using a function accounting for a lag phase followed by a single exponential. B, ANTS release after 180 min for each reaction plotted against the concentration of tBid or cBid. Points are the mean ± S.E. n = 3. Solid lines are best fit using a single exponential. t/cBid indicates tBid or cBid. Shown are duration of the lag phase (C) and the half-time of the subsequent exponential phase obtained by fitting the data shown in i and ii (lines) as a function of tBid (gray, open circles) and cBid (black, closed circles) concentration (mean ± S.E., n = 3; D). Linear (C) and Exponential lines (D) of best fit are shown. t/cBid indicates tBid or cBid. E, shown is membrane permeabilization obtained after preincubating cBid with the liposomes for different lengths of time. Liposomes encapsulating ANTS/DPX (0.5 nm) were incubated with 20 nm cBid for the times indicated to the right of the data points, and then 100 nm Bax was added at time = 0 (mean, n = 6). Shown is duration of the lag phase (F) and the half-time of the subsequent exponential phase (G) as a function of the cBid preincubation time with liposomes (mean ± S.E., n = 6). Exponential (F) and linear lines (G) of best fit are shown.

