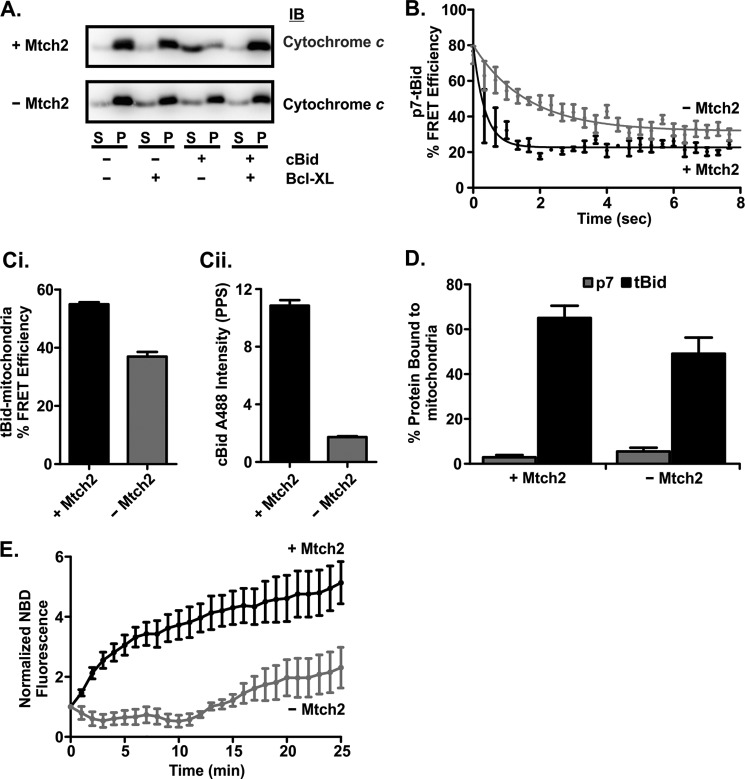
FIGURE 7.
Mtch2 facilitates the conformational change of tBid required for its activation upon binding to mitochondria. A, mitochondria lacking Mtch2 are less susceptible to cBid-induced MOMP. cBid (1 nm) and/or 50 nm Bcl-XL (indicated below the blots) were incubated for 30 min at 37 °C with 1 mg/ml mitochondria with and without Mtch2 as indicated to the left. Cytochrome c release was assayed by isolating the mitochondria by centrifugation and immunoblotting (IB) the bound protein in the pellet (P) fractions and free protein in the supernatant (S) fractions. B, separation of the p7·tBid fragments is very rapid when incubated with mitochondria isolated from the livers of mtch2+/+ or −/− mice. Mitochondria (1 mg/ml) with (black) and without (gray) Mtch2 were incubated with 2 nm cBid ΔK 126C labeled with Alexa Fluor 555 donor and Alexa Fluor 647 acceptor dyes. The decrease in % FRET Efficiency indicates the separation of the p7·tBid fragments of cBid ΔK 126C. % FRET efficiency was calculated by (1 − (F+A (t)/F−A (t))) × 100. F+A (t) is the fluorescence of cBid ΔK 126C labeled with Alexa Fluor 555 (donor) and Alexa Fluor 647 (acceptor). F−A (t) is the fluorescence of a parallel reaction with cBid ΔK 126C labeled only with Alexa Fluor 555 (donor). C, FRET measurements suggest cBid binds to but does not insert into mitochondria from mtch2−/− mice. 4 nm cBid 126C labeled with Alexa Fluor 488 (donor) was added to 1 mg/ml mitochondria from mtch2+/+ or mtch2−/− mice labeled with DiI (acceptor). An increase in % FRET efficiency indicates cBid binding to mitochondria. % FRET Efficiency was calculated by: (1 − (F+A (t)/F−A (t))) × 100. F+A (t) is the fluorescence of cBid 126C Alexa Fluor 488 in the presence of mitochondria labeled with DiI. F−A (t) is the fluorescence of a parallel reaction with cBid 126C Alexa Fluor 488 in the presence of unlabeled mitochondria. Ci, end points for the % FRET efficiency of the reaction after 30 min are shown. Cii, after 30 min of incubation of cBid 126C Alexa Fluor 488 with mitochondria, the samples were centrifuged, and the pelleted mitochondria were resuspended. The fluorescence of cBid 126C Alexa Fluor 488 in resuspended mitochondria is shown (mean ± S.E., n = 3). D, shown is binding of p7 and tBid fragments to mitochondria from mtch2+/+ and mtch2−/− mouse liver. 2 nm cBid 30C (p7, white bars) or 126C (tBid, black bars) labeled with Alexa Fluor 647 was incubated with 1 mg/ml mitochondria with or without Mtch2 (as indicated) for 20 min at 37 °C. The percentage of cBid bound to mitochondria was measured using fluorescence intensity distribution analysis by comparing the concentration of objects with a specific brightness equal to that of a single Bid molecule (presumably free protein), with the concentration of objects with a higher specific brightness (mitochondria with more than one bound fluorescent cBid molecule). Because a small number (1–4) of cBid molecules on a mitochondrion results in a specific brightness close to or equal to that of a single Bid and is considered as “free protein,” this analysis inherently underestimates the amount of bound protein. E, the conformational change in cBid upon binding to mitochondria is delayed in the absence of Mtch2. cBid 163C NBD (2 nm) was added to mitochondria (1 mg/ml) from mtch2+/+ or mtch2−/− mice, and the change in NBD fluorescence that occurs when the protein binds to membranes is expressed as F(t)/F0 (mean ± S.E., n = 3).

