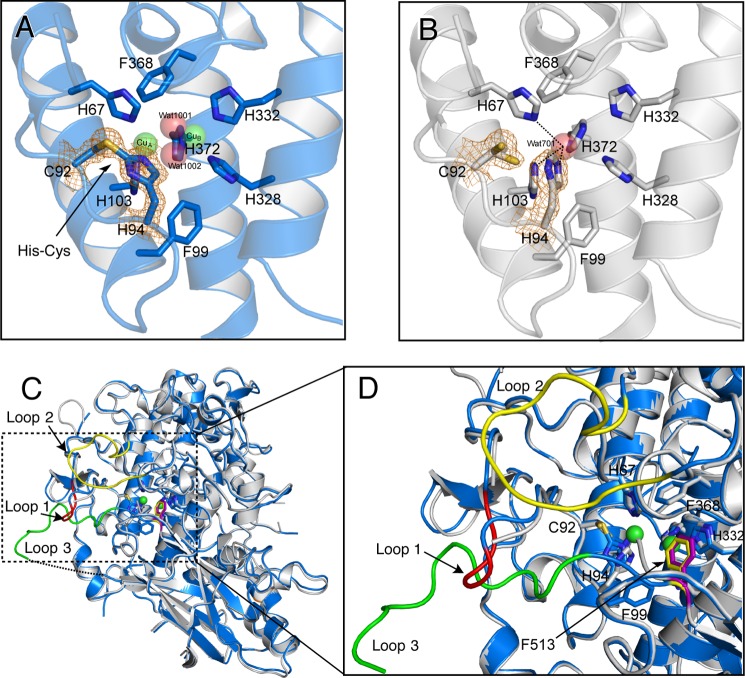
FIGURE 11.
Structural comparison of the holo-pro-form and apo-pro-form of melB. A, His94–Cys92 linkage of the holo-pro-form, and B, free Cys92 and His94 side chains of the apo-pro-form covered with electron density map (σ level = 1.5). C, superimposition of apo-form chain A (gray) and holo-form chain A (blue). Dashed rectangle indicates the disordered region of apo-pro-form chain A. Colored loops in this rectangle are loop 1 (Lys82–Lys85, red), loop 2 (Ser213–Phe223, yellow), and loop 3 (Ser516–Gly532, green) of holo-pro-form chain A. Dotted lines indicate the residues not visible in the electron density. D, superimposed structure of the active site region of apo-pro-form (chain A, gray) and holo-pro-form (chain A, blue and sphere). Residues are shown as stick models. Dotted lines indicate the closet contacts between atoms. Phe513 id shown as a stick model colored in yellow (holo) and purple (apo). Green spheres indicate copper ions.

