FIGURE 1.
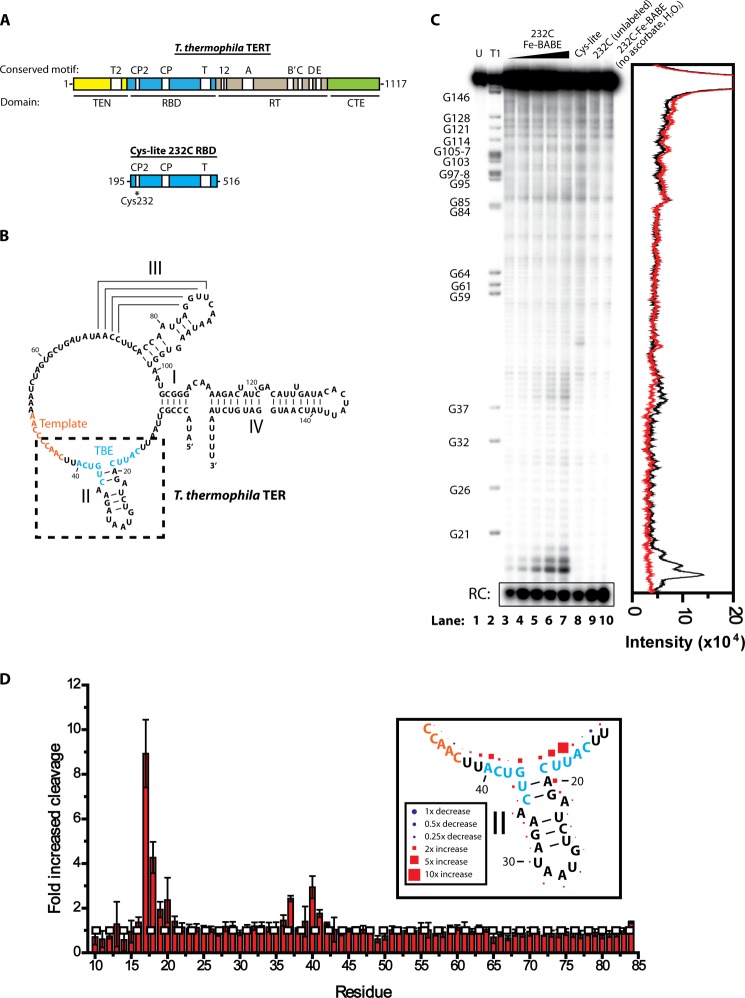
Hydroxyl radical probing of RBD-TER complexes. A, primary structure map of T. thermophila TERT, indicating the position of major domains and conserved motifs. For hydroxyl radical probing studies, an RBD construct was expressed with all endogenous cysteines mutated to alanine or serine, and a single cysteine reintroduced at residue 232 in the CP2 motif. B, secondary structure of T. thermophila TER, indicating the positions of stems I, II, III, and IV. The template RNA is highlighted in orange and the TBE is highlighted in blue. Box indicates region of interest highlighted in D. C, site-directed hydroxyl radical probing results for Cys232-Cys-lite RBD. Lane 1, TER alone; lane 2, RNase T1 digestion ladder of TER indentifying position of guanine residues; lanes 3–7, hydroxyl radical probing performed in the presence of 62.5, 125, 250, 500, and 1000 nm Cys232-Fe-BABE Cys-lite RBD, respectively; lane 8, 1000 nm Cys-lite RBD mock-labeled with Fe-BABE and hydroxyl radical probing performed; lane 9, 1000 nm unlabeled Cys232 TERT RBD hydroxyl radical probing; lane 10, 1000 nm Cys232-Fe-BABE-labeled Cys-lite RBD incubated with RNA without adding ascorbate and hydrogen peroxide. The chromatogram on the right demonstrates the intensity of cleavage products, comparing lane 7 (black) and lane 8 (red). D, hydroxyl radical probing performed using 1000 nm Cys232-Fe-BABE Cys-lite RBD and 1000 nm mock-labeled Cys-lite RBD. The experiment was repeated in triplicate and the -fold increase in cleavage was calculated at each residue using the gel quantifying program SAFA (18). Values represent the mean ± S.D. (error bars), with values above 1 indicating increased cleavage due to Fe-BABE-induced hydroxyl radical probing at residue 232 and values below 1 indicating decreased cleavage. Most residues showed no change; however, there was a significant increase in cleavage at the base of stem II. The white horizontal dashed line indicates no change in cleavage compared with the mock-labeled Cys-lite RBD construct. The inset represents the mean values in D plotted against the secondary structure, with the size of the shapes scaled to represent the degree of cleavage or protection.

