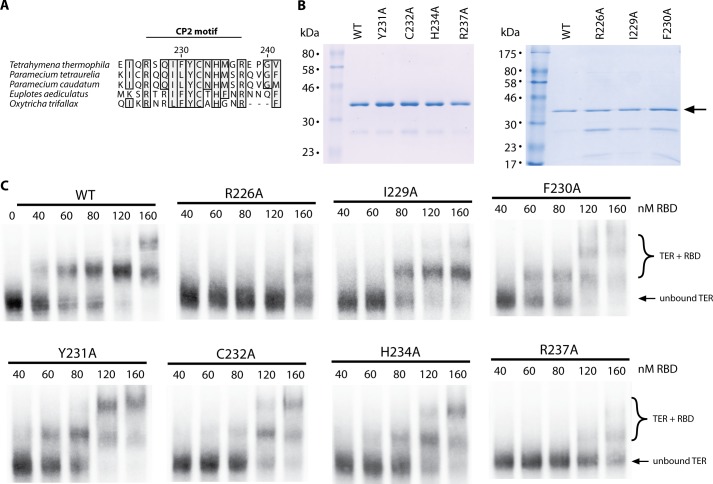
FIGURE 3.
CP2 motif mutants demonstrate weaker TER affinity by EMSA. A, sequence conservation map of the CP2 motif, comparing TERT sequences of five ciliate species. Numbering is for the residue numbers in the T. thermophila TERT sequence. B, left panel, SDS-PAGE gel of WT RBD as well as equal quantities of point mutants Y231A, C232A, H234A, and R237A. B, right panel, SDS-PAGE gel of purified WT RBD as well as R226A, I229A, and F230A protein. These constructs showed greater contamination, therefore the protein concentration was estimated by comparing the Coomassie Blue intensity at the RBD band (arrow) against the known WT RBD concentration. C, EMSAs for WT RBD (as shown in Fig. 2C) as well as all mutagenesis constructs. The bottom band represents unbound TER, and the top bands represent RBD-TER complexes.

