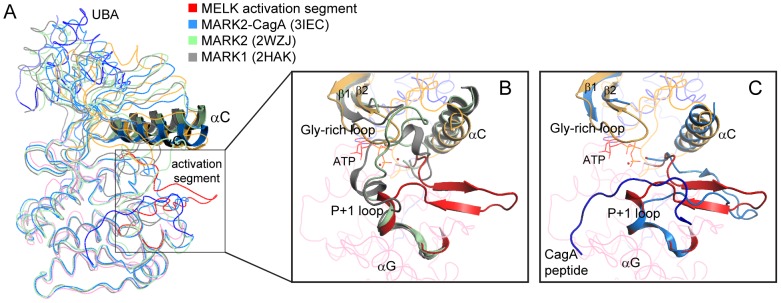
Figure 5. Conformational differences between the activation segments in MELK and MARK KD-UBA structures.

(A) Superposition of four KD-UBA structures with ordered activation segments. The MELK KD-UBA structure is colored as in Figure 2A, the MARK2-CagA complex (3IEC) in marine blue, the double mutant MARK2 (2WZJ) in light green, and the wildtype MARK1 (2HAK) in gray. For clarity, only the αC helices are depicted in cartoon. (B) Close-up view of the activation segments of MELK, MARK2 (2WZJ) and MARK1 (2HAK). The molecules are colored as in panel A. For clarity, the activation segment, helix αC and Gly-rich loop in MELK are highlighted, and only these elements in MARK1 and 2 are shown. The ATP molecule adapted from PKA (1ATP) is shown as red lines. (C) Close-up view of the activation segments of MELK and the MARK2-CagA complex (3IEC). For the MARK2-CagA complex, only the activation segment, helix αC, Gly-rich loop and the CagA peptide (blue) are shown.
