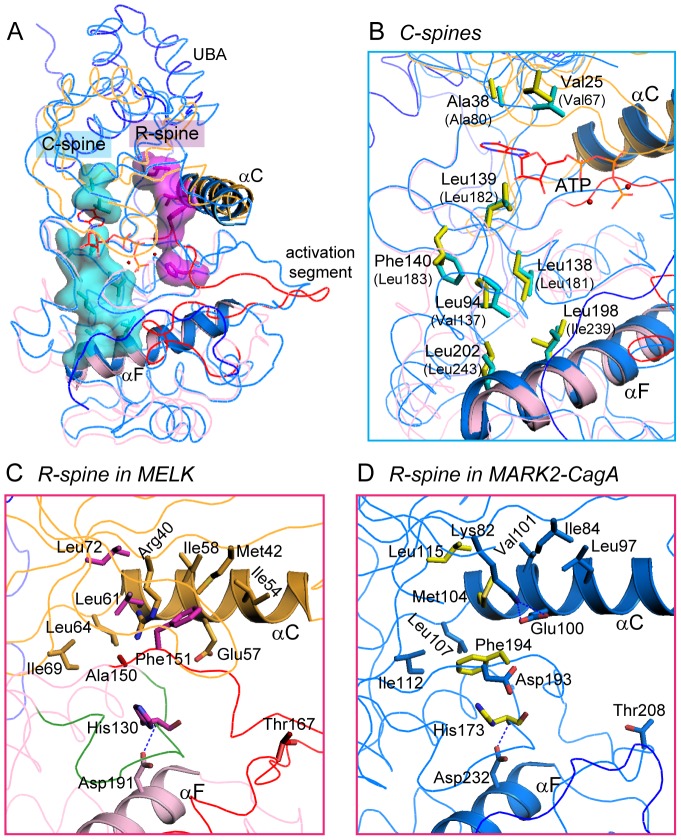
Figure 6. Comparison of the C-spine and R-spine in MELK and MARK2.
(A) The C- and R-spines in our MELK KD-UBA structure. Residues in the C-spine and the R-spine of MELK are highlighted as cyan and magenta sticks, respectively, and additionally in surface model. The MARK2-CagA complex is shown for comparison, and the ATP molecule adapted from PKA (1ATP) is shown as red lines. The coloring schemes for MELK and MARK are as in Figure 5A. (B) Close-up view of the C-spine residues in MELK and MARK2-CagA. The corresponding residues of MARK2 are shown as yellow sticks and labeled in parentheses. (C and D) Close-up views of the R-spines of MELK (C) and MARK2 (D). Residues composing the R-spine and surrounding the DFG motif are shown as sticks. In panel C, the catalytic loop in MELK is colored green.

