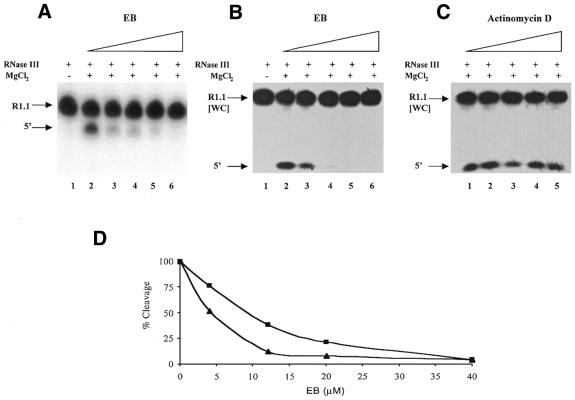
Figure 2.
Ethidium inhibition of substrate cleavage by RNase III. Cleavage assays were performed as described in Materials and Methods using 5′-32P-labeled substrate. Therefore, the only observable cleavage product is the one containing the substrate 5′-end [indicated by 5′ on the left side of (A) and (B)]. EB was combined with substrate in assay buffer, followed by RNase III (6 nM for R1.1 RNA and 4 nM for R1.1[WC] RNA). MgCl2 was added to initiate cleavage and the reaction time was 30 s. Reactions were stopped and electrophoresed in a 15% polyacrylamide, 7 M urea gel. Reactions were visualized and quantitated by autoradiography and phosphorimaging, respectively (see Materials and Methods). (A) EB inhibition of R1.1 RNA cleavage. Lane 1, no Mg2+; lane 2, no EB; lane 3, 4 µM EB; lane 4, 12 µM EB; lane 5, 20 µM EB; lane 6, 40 µM EB. (B) EB inhibition of R1.1[WC] RNA cleavage. Lane 1, incubation of substrate with RNase III in the absence of MgCl2; lane 2, no EB; lane 3, 4 µM EB; lane 4, 12 µM EB; lane 5, 20 µM EB; lane 6, 40 µM EB. (C) Effect of AD on R1.1[WC] RNA cleavage. The experiment was performed as described in (A). Lane 1, no AD; lane 2, 4.1 µM AD; lane 3, 12.4 µM AD; lane 4, 20.6 µM AD; lane 5, 41.2 µM AD. (D) Comparison of the EB inhibition profiles for R1.1 RNA and R1.1[WC] RNA. The triangles indicate EB inhibition of R1.1[WC] RNA cleavage, while the squares indicate EB inhibition of R1.1 RNA cleavage. The 100% cleavage value represents the amount of cleavage occurring in 30 s in the absence of EB. For R1.1 RNA each point represents the average of two experiments. The value at 4 µM EB is 77 ± 47%; at 12 µM EB, 38 ± 22%; at 20 µM EB, 21 ± 16%; at 40 µM EB, 4 ± 2%. For R1.1[WC] RNA each point represents the average of three experiments. The value at 4 µM EB is 52 ± 10%; at 12 µM EB, 13 ± 8%; at 20 µM EB, 8 ± 5%; at 40 µM EB, 5 ± 1%.

