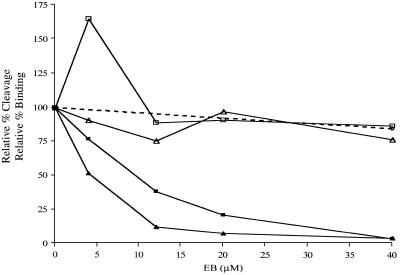
Figure 5.
Ethidium-dependent uncoupling of substrate binding and cleavage by RNase III. The cleavage inhibition curves (filled squares and triangles) are from Figure 2D. Data from four gel shift assays were averaged to generate the points for R1.1[WC] RNA (open triangles): at 4 µM EB, 91 ± 35%; at 12 µM EB, 76 ± 24%; at 20 µM EB, 97 ± 48%; at 40 µM EB, 77 ± 16%. Data from two gel shift assays were used to generate the points for R1.1 RNA (open squares): at 4 µM EB, 165 ± 32%; at 12 µM EB, 89 ± 21%; at 20 µM EB, 91 ± 13%; at 40 µM EB, 87 ± 8%. See text for an explanation for the enhancement of R1.1 RNA binding at 4 µM EB. The relatively greater maximum error values at low EB concentrations is discussed in Materials and Methods. The effect of NaBr on RNase III binding to R1.1[WC] RNA is indicated by the dotted line. The relative percent binding at 40 µM NaBr was 85 ± 27% (average of two experiments, shown by the filled circle). At 100 µM NaBr (data not shown) the relative percent binding was 61 ± 13%.

