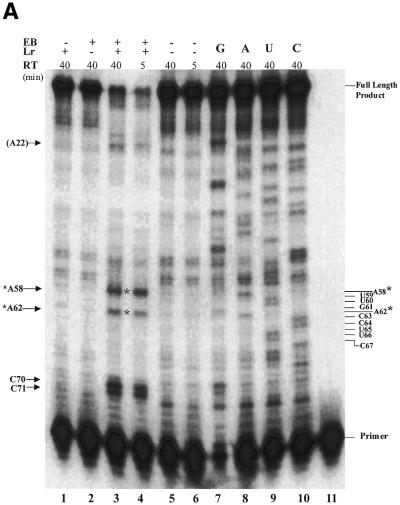
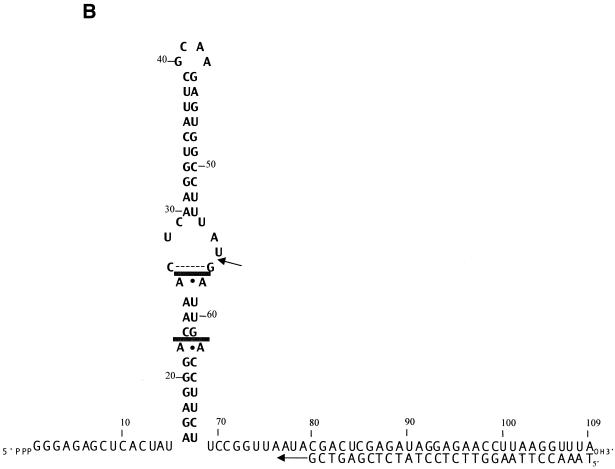
Figure 7.
Photocleavage mapping of the ethidium-binding sites in R1.1 RNA. Laser irradiation and RT–PE analysis were performed as described in Materials and Methods. Irradiation was for 25 min. (A) RT–PE analysis of the irradiated R1.1 RNA–EB complex, as revealed by phosphorimaging. The complete experiments are shown in lanes 3 and 4 (40 and 5 min reaction times, respectively). The asterisks indicate the main positions of EB-dependent photocleavage [A62 and A58; see (B)]. The control experiments are shown in lanes 1, 2, 5 and 6. Lane 1, analysis of R1.1 RNA irradiated in the absence of EB; lane 2, analysis of R1.1 RNA and EB with no irradiation; lanes 5 and 6, analysis of R1.1 RNA in the absence of EB or irradiation at two reactions times (40 and 5 min, respectively); lanes 7–10, PE reactions carried out in the presence of each of the four dideoxynucleoside 5′-triphosphates; lane 11, position of the RT primer. (B) Diagram of R1.1 RNA showing the positions of the two ethidium-binding sites (indicated by stippled bars). The dotted line connecting C27 and G57 indicates a tentative hydrogen bonding interaction stabilized by ethidium binding (see Discussion). The RT primer is shown bound to its complementary sequence at the 3′-end of R1.1 RNA.


