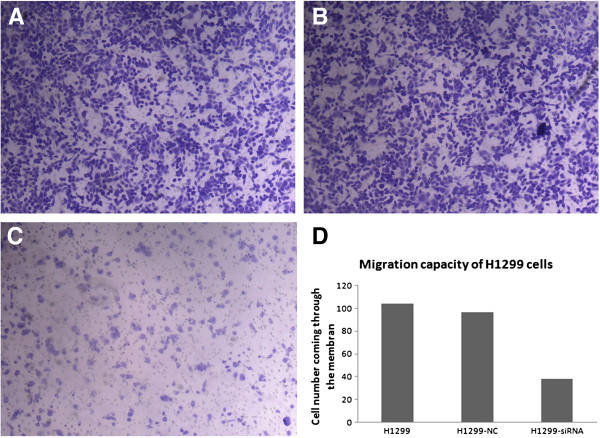
Figure 3.
Migration capacity of different groups of H1299 cells. A: non-transfected group; B: negative control group; C: transfected group(X100). D Histogram of migration capacity of different groups of H1299 cells. The number of the cells coming through the membrane in group C is much less than that of the group A and B. No significant difference was seen between group A and B.

