Figure 2.
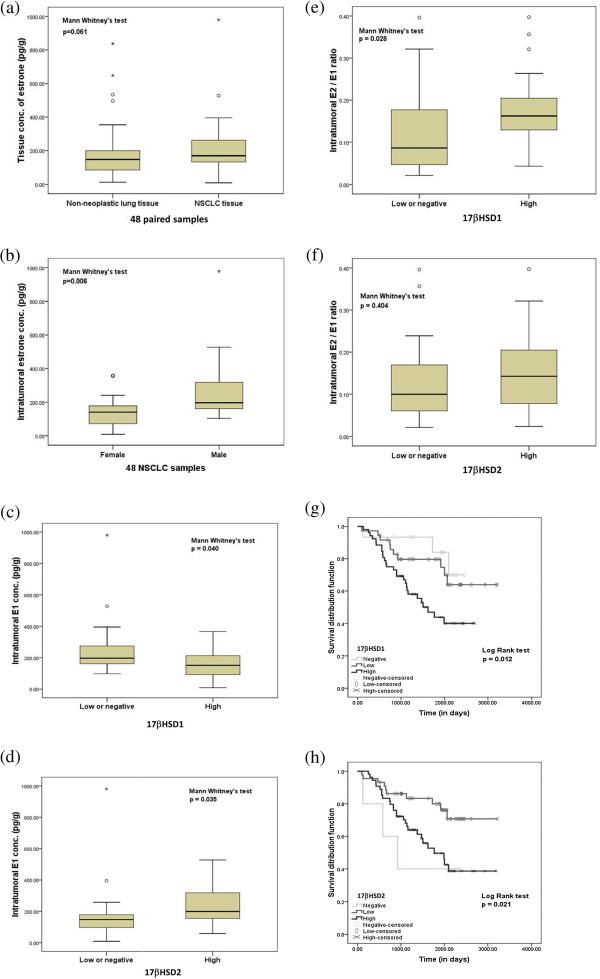
Intratumoral estrogens concentration and overall survival in NSCLC patients. (a) Intratumoral concentration of estrone in 48 NSCLCs and corresponding non-neoplastic lung tissues. (b) Intratumoral concentration of E1 in male and female NSCLCs. Association between intratumoral E1 concentration in 49 NSCLCs, (c) either with 17βHSD1 or (d) with 17βHSD2 enzymes. Association between intratumoral E2/E1 concentration in 49 NSCLCs, (e) either with 17βHSD1 or (f) with 17βHSD2 enzymes. The grouped data are represented as box plots. The median value is shown by a horizontal line in the box plot and the box denotes the 75th (upper margin) and 25th percentiles of the values (lower margin). Kaplan–Meier survival curves in 103 NSCLC patients, (g) according to 17βHSD1 immunoreactivity; negative vs. low vs. high and (h) according to 17βHSD2 immunoreactivity; negative vs. low vs. high.

