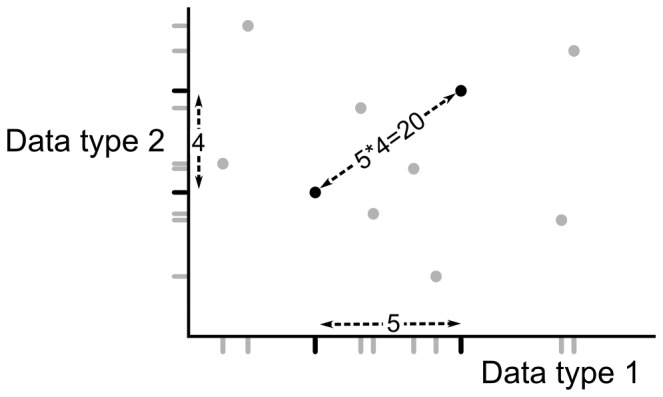
Figure 3. Graphical representation of the dissimilarity measure between cases.

Shown is a dataset of nine cases and two (one-dimensional) data types. For each of the two data types, the dissimilarity between the two black cases is given as the number of cases in between them (for that data type), including one of the two black cases. This definition ensures the dissimilarity between a case and itself is zero. The total dissimilarity between the black cases is then given as the product of these, here 5*4 = 20.
