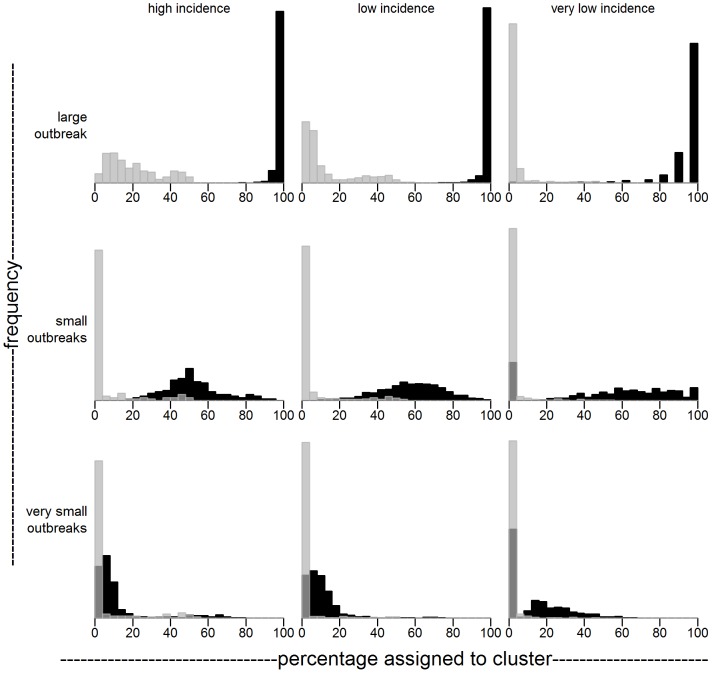
Figure 5. Sensitivity (black) and false positive rate (gray) for analyses on simulated datasets.
For each of nine simulation scenarios, percentage of outbreak (black) and non-outbreak (gray) cases assigned to a putative transmission cluster are shown. In each scenario, ten percent of all cases are an outbreak case. Total expected number of cases is (left column) 1000, (middle column) 500 or (right column) 100. Outbreak cases belong to (top row) one large outbreak, (middle row) small outbreaks caused by 1/10 of cases being contagious with basic reproduction number R = 0.5, (bottom row) very small outbreaks caused by all cases being contagious with R = 0.1. For all scenarios, outbreak cases are distinguishable from unrelated cases. Sensitivity increases with outbreak size, at the cost of an increased false positive rate. Sensitivity and false positive rate improve when the incidence, or equivalently the number of cases in the same region of spacetime, decreases. Figure 4 corresponds to a simulation from the middle left panel.

