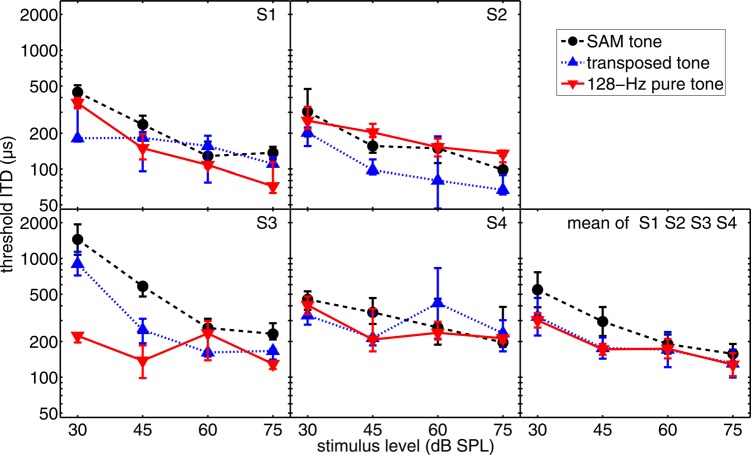
Figure 1.
(Color online) Threshold ITD for different types of stimuli as a function of stimulus level. The SAM stimulus with fm = 128 Hz is indicated by circles and a dashed line in this and all following figures. The transposed tone is marked by upward triangles and the pure tone by downward triangles. In the four left-most panels, the individual data of the four subjects are shown. The data points indicate the median and the error bars indicate the interquartile range from the six measurements of each condition. In the panel on the right-hand side the geometric mean across subjects is plotted, together with the geometric standard errors.

