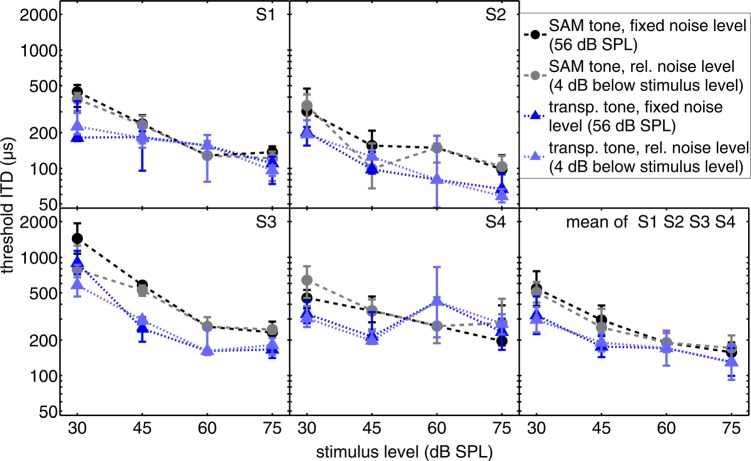
Figure 4.
(Color online) Threshold ITD of SAM and transposed tones for different levels of the low-frequency noise as a function of stimulus level. The data are plotted in the same format as Fig. 1. The two dark plotted conditions represent measurements re-plotted from Fig. 1 measured with a constant absolute noise level (56 dB SPL). The two lighter plotted conditions were measured with a constant relative noise level of (4 dB below signal level). For the 60 dB signal level, where both the constant noise and the relative noise have a level of 56 dB, the same data is utilized for both conditions.

