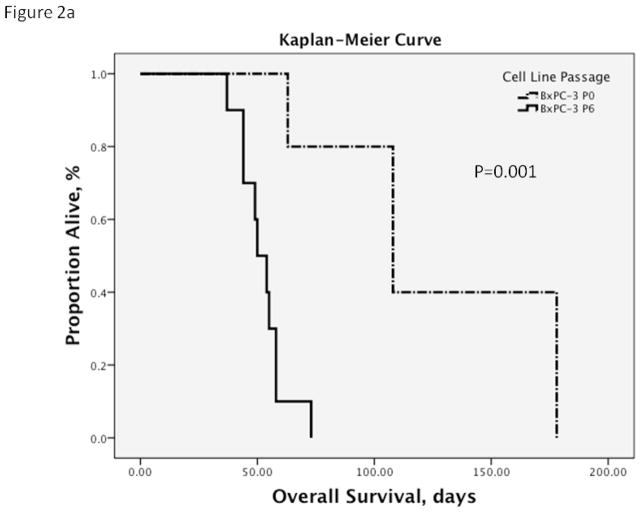
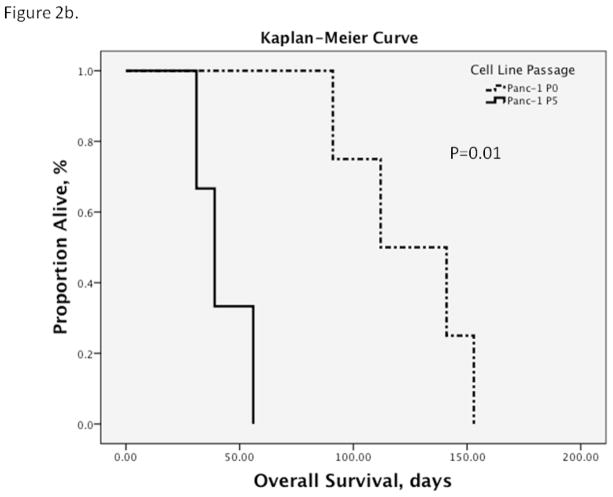
Figure 2. Kaplan-Meier Survival Curves.
a. By the 6th in vivo passage of BxPC-3, the overall survival in P6 tumor-bearing mice had decreased from an average of 127 days (95% CI 83.1, 170.9) to 52.2 days (95% CI 46.0, 58.4) compared to the parental cell line (P0). The median survival decreased from 108 days of the parental line (95% CI 59.7, 156.3) to 50 days (95% CI 42.3, 57.7; p=0.001).
b. There was a similar effect with serial in vivo passaging of Panc-1. Overall survival in P5 tumor-bearing mice decreased from an average of 124.3 days of the parental line (95% CI 96.7, 151.8) to 42 days (95% CI 27.6, 56.4) compared to the parental cell line (P0). Median overall survival shortened from 112 days (95% CI 63, 161) to 39 days (95% CI 26.2, 51.8; p=0.01).


