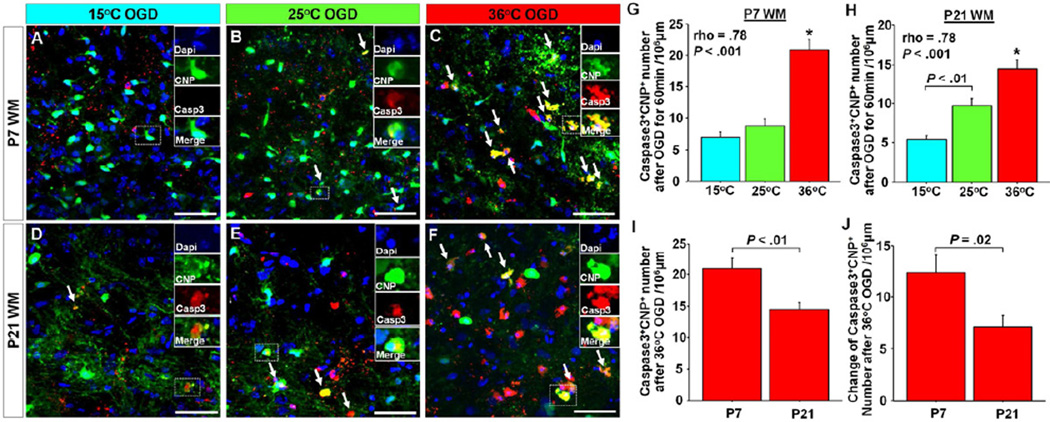
Figure 4.
A–F, Images of Caspase3+ oligodedrocytes in P7 and P21 WM between three OGD groups. G,H, Caspase3+CNP+ cell number in P7 and P21 WM after 60 min OGD between three temperature groups. There are significant differences among 3 groups in both P7 (F = 33.4, P < .001; n=15, 13, and 16 in 15, 25, and 36°C OGD, respectively) and P21 (F = 23.5, P < .001; n=12, 15, and 15 in 15, 25, and 36°C OGD, respectively). The numbers are significantly correlated with temperature during OGD. I, Caspase3+CNP+ cell number after 36°C OGD for 60 min between P7 and P21 WM (n=6 each). J, Changes of Caspase3+CNP+ cell number after 35°C OGD from Control between P7 and P21 WM (n=6 each). *P < .001 vs. other two groups by ANOVA with Bonferroni comparisons. Arrows indicate Caspase3+CNP+ cells. Scale bar = 50 µm, Data are shown as mean ± SEM.

