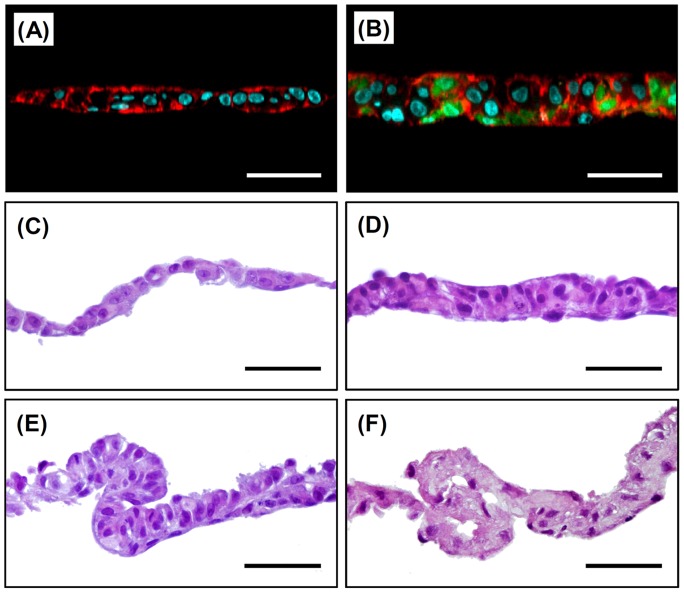
Figure 5. Cell distributions and HE stained images of the cross-sections of cell sheets.
Fluorescent (A, B) and HE (C–F) stained images. (A, C) HepaRG cells, (B, D, E) TIG-118/HepaRG cells and (F) TIG-118 cells. Green (CellTracker Green CMFDA): TIG-118 cells, Red (Alexa Fluor 568 Phalloidin): F-actin, Blue (DAPI): nucleus. The bars represent 50 µm.

