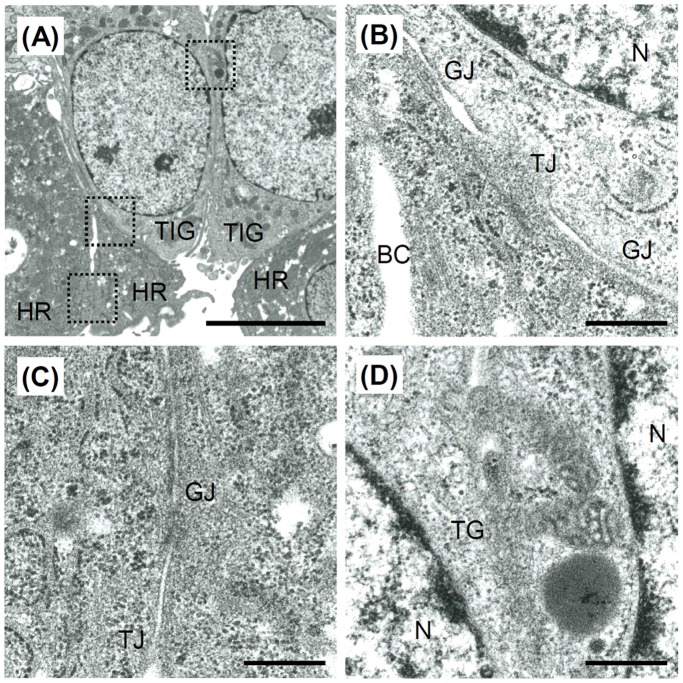
Figure 6. Ultrastructures of the TIG-118/HepaRG cell sheets observed by TEM.
(A) Low magnification and (B–D) high magnification images of the cell-cell adhesion between HepaRG cell and TIG-118 cell (B), HepaRG cells (C) and TIG-118 cells (D). HR, HepaRG cell; TIG, TIG-118 cell; N, nucleus; BC, bile canaliculi; TG, tight junctions; GJ, gap junctions. The bars represent 5 µm (A) and 500 nm (B–D).

