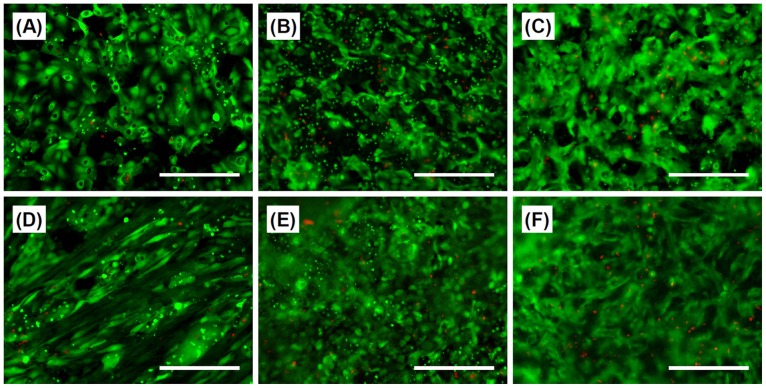
Figure 8. Live and dead stained fluorescent images.
(A–C) HepaRG cells and (D–F) TIG-118/HepaRG cells. (A, D) After four days of culturing HepaRG cells on the TRCD and (B, E) after two hours and (C, F) 24 hours of reculturing cell sheets on glass-based dishes. Green (Calcein-AM): viable cells, red (PI): dead cells. The bar represents 200 µm.

