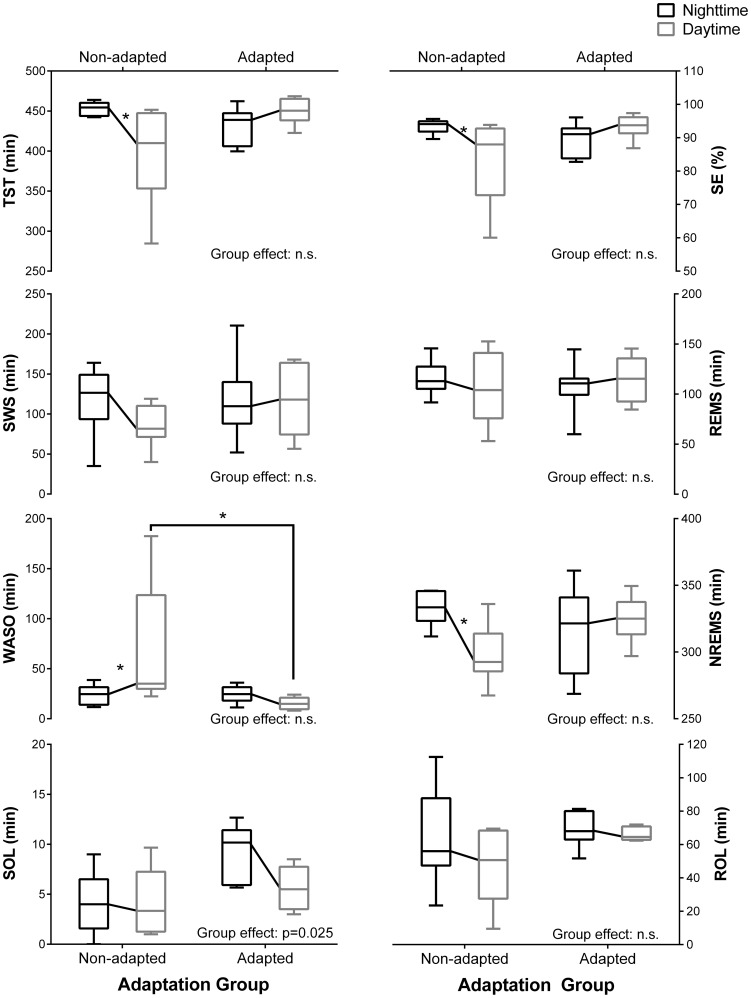
Figure 2. Variation in the PSG sleep measurements during nighttime and daytime sleep (laboratory visits 1 and 2) in both adaptation groups.
Nighttime (black boxes) and daytime (grey boxes) sleep measurements are illustrated by boxplots. The bottom and top of each box are the first and third quartiles of each group, respectively, and the band inside each box is the median. The top and bottom whiskers illustrate the 5th and 95th percentile, respectively, for each group. TST: total sleep time; SE: sleep efficiency; SWS: slow wave sleep; REMS: rapid eye movement sleep; WASO: wake after sleep onset; NREMS: non-REM sleep; SOL: sleep onset latency; ROL: REMS onset latency. The PSG sleep measurements were compared using a linear mixed effect model with visit and adaptation group as factors. Asterisks (*) indicates a significant difference (p<0.05) between laboratory visits or between groups.

