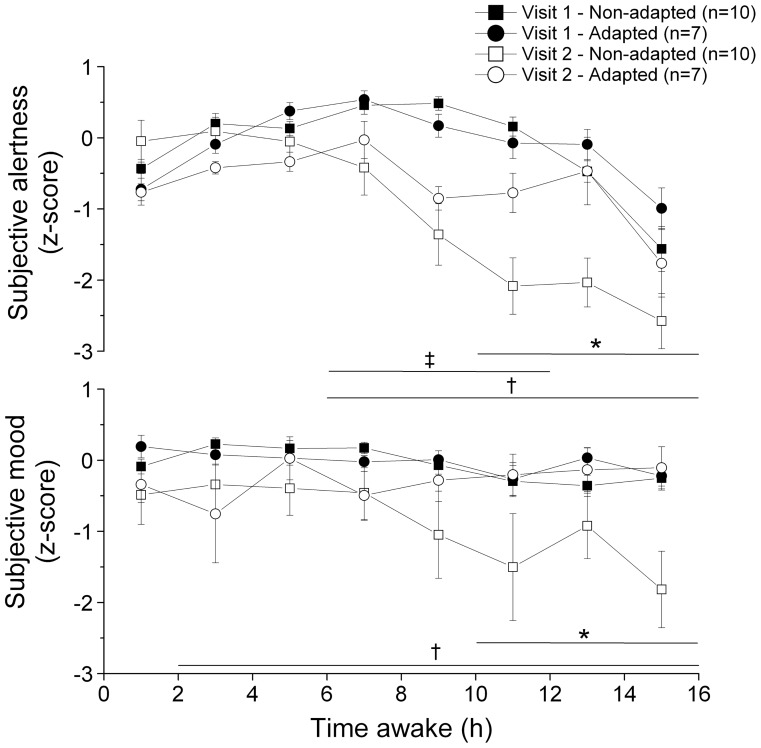
Figure 4. Subjective alertness (upper panel) and subjective mood (lower panel) levels with time awake during laboratory visits 1 (filled symbols) and 2 (open symbols) in the adapted (circles) and non-adapted (squares) groups.
Higher values indicate higher scores. A linear mixed effect model with time awake, sleep time and adaptation group as factors was used to compare the subjective alertness and mood levels. The time periods during which this model revealed significant differences are illustrated by horizontal lines. Asterisks (*) linked with a horizontal line indicate lower alertness or mood levels in the non-adapted group compared to the adapted group during laboratory visit 2. † linked with a horizontal line indicate significant differences (p<0.05) in subjective alertness or mood between laboratory visits in the non-adapted group. ‡ linked with and a horizontal line indicates a significant difference between visits in the adapted group. For illustrative purposes, the alertness and mood z-scores were binned every 2 h and the results are illustrated as means ± SEM at mid-bin.

