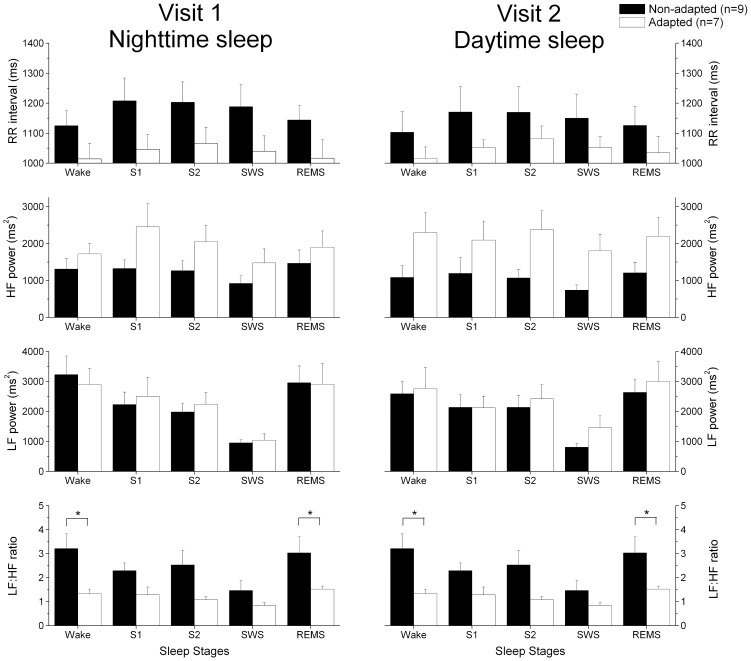
Figure 5. Variation in the consecutive RR intervals, HF power, LF power and LF∶HF ratio during nighttime (visit 1) and daytime (visit 2) sleep.
Wake: wake from lights out to lights on; S1: stage 1 sleep; S2: stage 2 sleep; SWS: slow wave sleep; REMS: rapid eye movement sleep. A linear mixed effect model was applied to the data for each subject using the mixed SAS procedure. We used 3 comparison factors: adaptation group, laboratory visit, and sleep stages. A significant main effect of sleep stage was observed for all HRV parameters (p≤0.004). There was a trend for the HF power to be increased in the adapted group compared to the non-adapted group (p = 0.07). A significant adaptation group×sleep stages interaction was also observed (p = 0.01). Asterisks (*) indicate a significant differences between the adaptation groups (p<0.05). All values are means ± SEM.

