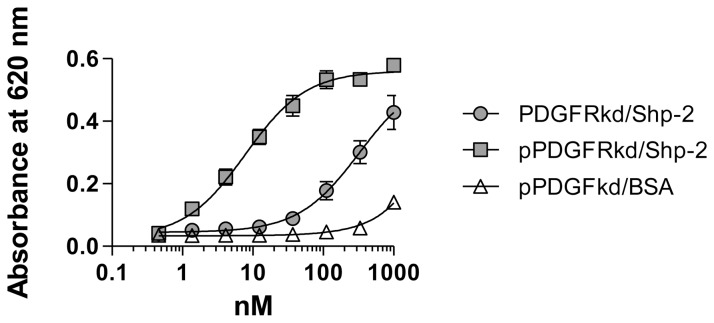
Figure 2. Quantitative analysis of interaction of the PDGFRβ kinase domain with SHP-2.
Increasing concentrations of phosphorylated (closed squares) or unphosphorylated PDGFRβ KD (closed circles) were incubated with microtiter wells coated with SHP-2. Bound PDGFRβ KD was detected using an anti-PDGFRβ antibody. As a control, the binding of phosphorylated PDGFRβ KD to BSA (open triangles) was also measured. Curves show the best fit to a single class of sites using non-linear regression analysis. The binding of pPDGFRβ to SHP-2 is significantly different from the binding of PDGFRβ to SHP-2 (p = 0.0002, Students t test).

