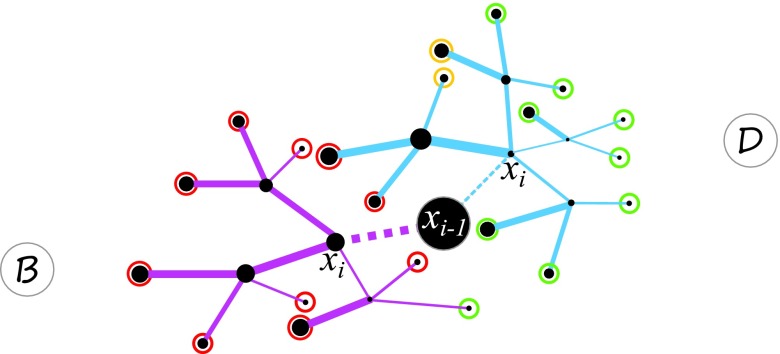
Figure 2.
Look-ahead strategy. Two reactions leading current state to next state are shown in dashed lines (blue and pink). All possible look-ahead paths of length κ = 2 for both reactions from two different next states are illustrated in solid blue and pink lines. State B is the initial state, and D is the target state. The thickness of lines indicates reaction rates. The color of circles at the end state of each path indicates moving forward (green, ), backward (red, ), and non-moving (yellow, ).

