Figure 4.

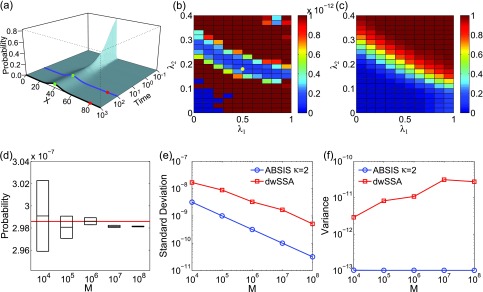
The birth-death model of Eq. 21. (a) Its time-evolving probability landscape. The blue and black curves highlight the landscape at t = 100 and at the steady state, respectively. There is one high probability region located at x = 40 in both landscapes (green dots), which is also the initial state. The target state (red dots) is outside the high probability region. (b) and (c) The variance (b) and success rate (c) of pilot ABSIS sampling during parameter search using a total sampling size of M = 9.2 × 10⁴ and look-ahead path length of κ = 2. The yellow dot in (b) shows the location of the optimal parameters. (d) The estimated transition probability and sample convergence using ABSIS. The solid red line indicates the exact probability calculated from dCME. Black bars and heights of the box-plots are the mean and its standard deviations of estimated transition probability calculated from 4 independent ABSIS simulations, each for a different sample size of M = 104, 105, 106, 107, and 108, respectively. (e) Standard deviations of ABSIS (blue line) and dwSSA (red line) at different sample sizes. (f) Sample variances of the ABSIS (blue line) and the dwSSA (red line) method at different sample sizes.
