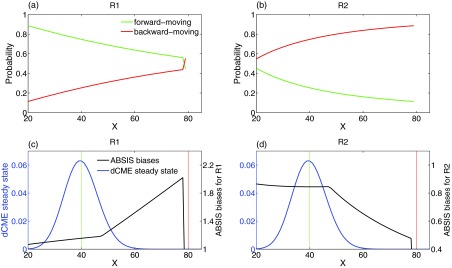
Figure 5.

Forward and backward moving probabilities. (a) and (b) Probability of moving-forward and moving-backward for two reactions R1 and R2 in birth-death model. The x-axis is the system state, i.e., the copy number of molecular species X, and y-axis is the forward-moving (green lines) and backward-moving (red lines) probabilities of reaction R1 and R2 in each state. (c) and (d) The final ABSIS bias strengths for both reactions in birth-death model. Blue lines show the steady state probability landscape of birth-death model. The black lines in (c) and (d) show the curves of bias strengths for reactions R1 and R2, respectively. Green and red vertical lines indicate the start and end state.
