
Figure 6. FRET copolymerization analysis of actin isoforms.
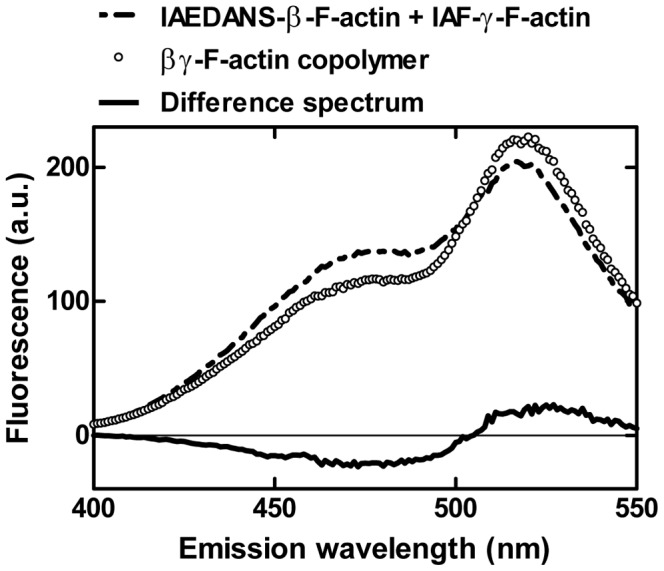
Fluorescence emission spectra of IAEDANS-β-actin and IAF-γ-actin, both separately polymerized and after copolymerization. The donor fluorescence (IAEDANS) peaks around 490 nm and decreases significantly upon copolymerization whereas the fluorescence of the acceptor (IAF) at 520 nm apparently increases as shown in the difference spectrum.