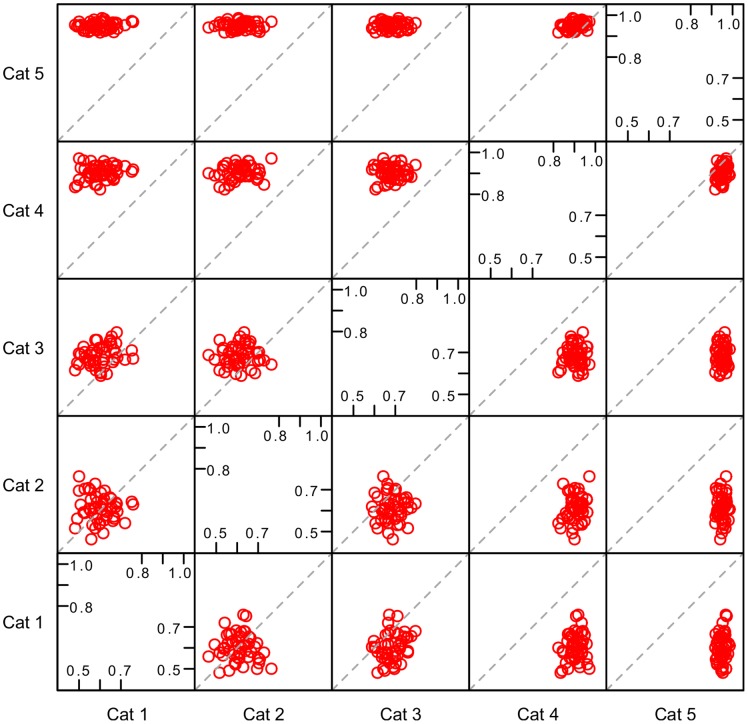
Figure 5. Pairwise correlation between feature categories resampled performance.
Points concentrated around the diagonal in the top right corner of plots represent a pair of feature categories with strong relationship and good joint performance, while points widely spread in the bottom left corner of plots depicts the existence of a weak relationship between two categories that also perform weakly in the resampled evaluation. Categories one (alignment features) and two (thermodynamic features) have weak relationship and both have poor resampled performance, whereas categories four (seed features) and five (position-based features) show strong relationship, both of them with high resampled performance.

