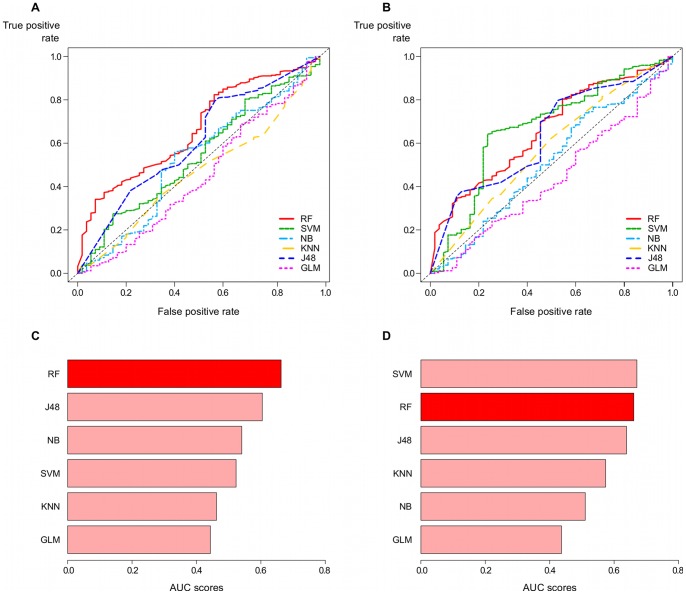
Figure 10. Comparative performance of RFMirTarget for a completely independent test data set.
We test the proposed RF model with a collection of experimentally verified positive and negative examples downloaded from TarBase 5.0, comparing it against some counterpart methods. Panels A and C refer to models trained with the complete set of features, whereas panels B and D present results for the training process based on the subset of top 12 features. This analysis raises more evidence to the good overall performance of our method in relation to other popular classifiers. In general, ROC curves for the RF model (panels A and C) are more far away from the diagonal line, which denotes a random classifier with no predictive power. Moreover, a permutation test based on label randomisation to evaluate the statistical significance of the computed AUC scores returns the lowest p-values for the RF-based approach in both situations (training with all features and training with the top 12 features), indicating that these results would be unlikely to occur by chance.

