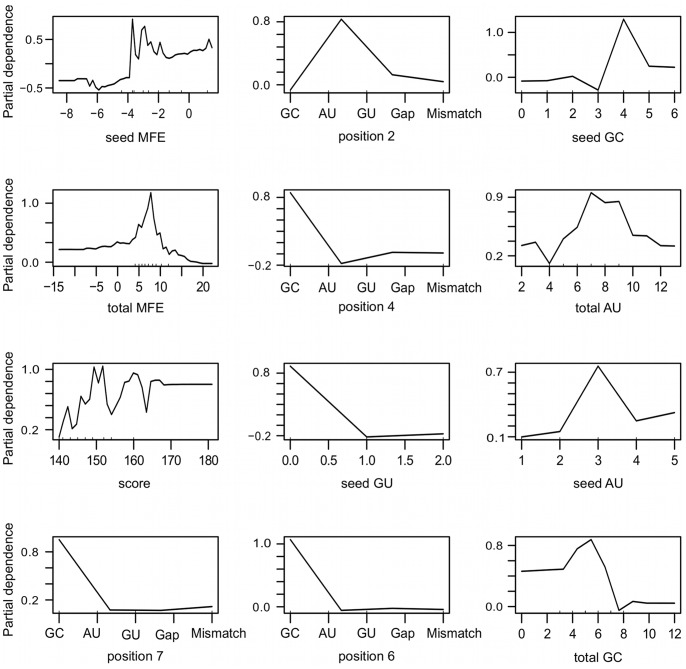
Figure 11. Partial dependence plots for the top 12 relevant features.
These plots depict the effect of different values of a given variable on the class prediction, allowing us to further interpret the ensemble model and its weaknesses. Structural features related to the seed region, namely the absolute frequency of G:C, A:U and G:U alignments, show an unimodal curve, with very well defined values for high class probabilities. One can observe, for instance, that three or more G:C alignments in the seed region may disrupt correct classification of true miRNA-target pairs, while three A:U alignments is very decisive for the recognition of true positive instances. Moreover, as expected, G:U occurrence drastically decrease the class probability. In what concerns the position-based features, the analysis of the plots suggest that a G:C alignment in position 2 in detrimental for miRNA-target recognition, conversely to what is observed for positions 4, 6 and 7.

