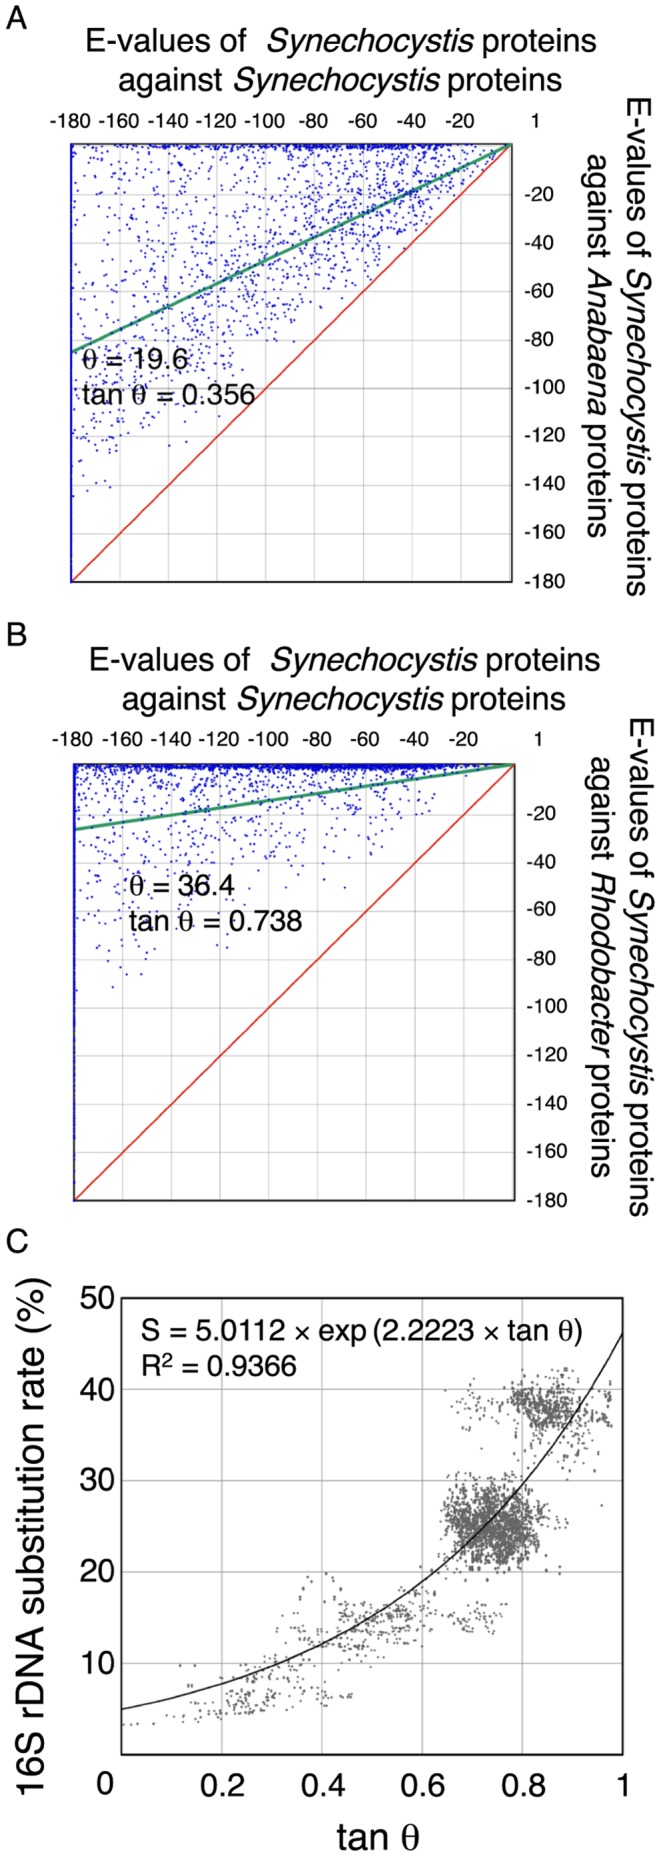
Figure 1. Evolutionary distance based on protein similarity and its relationship to rDNA substitution rate.

Representation of best-matched proteins on a two-dimensional display. The vertical axes represent the logarithmic E-values of the best-matched proteins of Anabaena sp. PCC 7120 (A) and Rhodobacter sphaeroides 2.4.1 (B) to the proteins of Synechocystis sp. PCC 6803. The horizontal axes represent the logarithmic E-values of the best-matched proteins of Synechocystis sp. PCC 6803 to Synechocystis sp. PCC 6803 (A, B). In this case, the best-matched proteins are identical to the query proteins. The green lines are linear regression lines and the red lines mark the diagonal. θ is the angle between the red and green lines. (C) Relationship between tan θ and the 16S rDNA substitution rate. Each point represents the tan θ values (vertical axis) calculated with two genomes and the substitution rates of their 16S rDNA sequences (horizontal axis). The solid line represents the regression curve.
