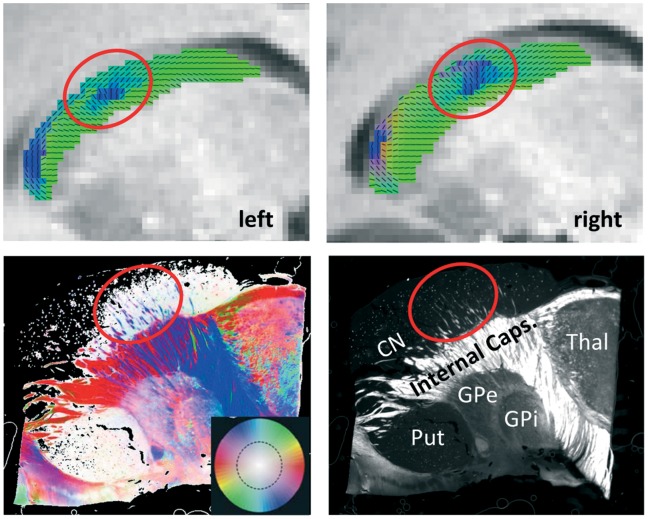
Figure 2. Direction-coded color images of the main diffusion direction derived from diffusion tensor imaging (DTI; blue: inferior-superior; red: left-right; green: posterior-anterior), averaged across participants, superimposed on sagittal anatomical slices of the typical subject (in Talairach space) of the left and right caudate nucleus (CN; see upper panels).
In a sagittal view, the radial fibers (RF) of the CN (lower panels) can be seen as inferior-superior fiber bundles that connect the CN with the globus pallidus (GP) crossing the internal capsule (IC). Lower left: Fiber orientation map from polarized light imaging (PLI) of a sagittal section through the CN comparable to the section shown with DTI. Fiber directions within the image plane are color-coded and fiber inclination is saturation-coded (see color circle in the inset). Lower right: Maximum intensity map of the same section, which shows the maximum intensity of the polarization sequence and encodes the inclination of the fiber directions. White pixels mark myelinated fibers (dependent on their inclination, the steeper the darker), while dark pixels denote unmyelinated or perpendicular structures. Anatomical structures are labeled: CN = caudate nucleus, Put = putamen, GPe = external globus pallidus, GPi = internal globus pallidus, Thal = thalamus. Note that there is high coherence between the RFs in the CN, as visualized with PLI, and the fiber directions seen in DTI (circles). All individual subjects show similar patterns, see Figure S1.

