
Figure 2. pilBWA suppresses some but not all T4P− pil deletions in EPS production.
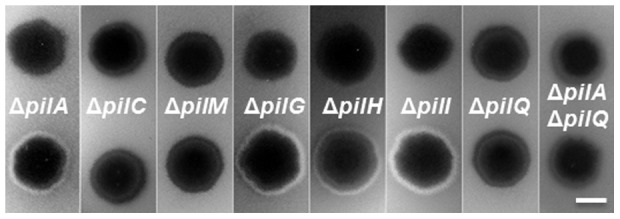
EPS levels were analyzed on plates with the fluorescent dye Calcofluor white (See Materials and Methods). The presence of fluorescence indicates EPS+ and its absence EPS−. Each strip shows two strains, the upper is a strain with the indicated mutation(s) in a pilB+ background and the lower in the pilBWA background. Strains used are YZ690 (ΔpilA), YZ1573 (ΔpilA pilBWA), DK10417 (ΔpilC), YZ1182 (ΔpilC pilBWA), YZ1860 (ΔpilM), YZ1185 (ΔpilM pilBWA), DK11135 (ΔpilG), YZ1183 (ΔpilG pilBWA), DK11133 (ΔpilH), YZ1181 (ΔpilH pilBWA), DK11132 (ΔpilI), YZ1184 (ΔpilI pilBWA), YZ1191 (ΔpilA ΔpilQ) and YZ1190 (ΔpilA ΔpilQ pilBWA). pilBWA failed to suppress ΔpilN, ΔpilO, ΔpilP and ΔpilQ as it did ΔpilC and ΔpilM (data not shown).