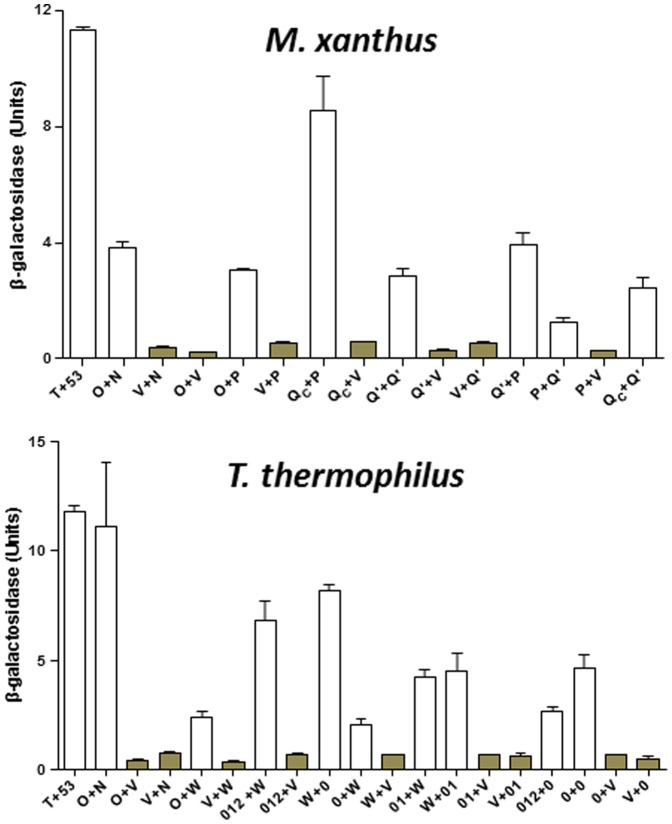
Figure 5. Quantification of β-galactosidase in Y2H experiment.
The upper and lower panels show the β-galactosidase activity for Pil protein interactions in Y2H experiments from M. xanthus and T. thermophilus, respectively. The values for β-galactosidase activity were the average of three independent experiments and samples in each experiment were analyzed in triplicate. See Figure 4 for protein designations under each panel. The bars for the vector controls are shaded for comparison. See text and Materials and Methods for more details.

