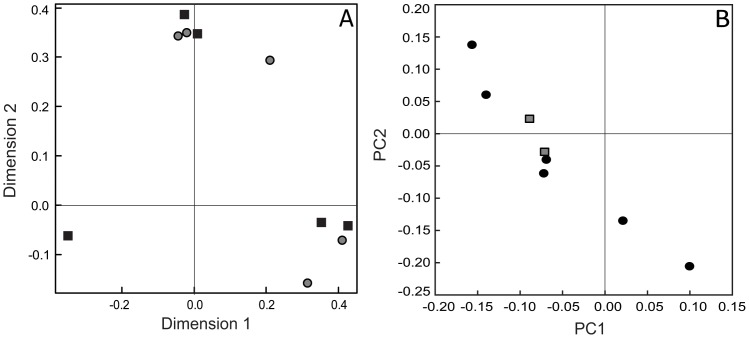
Figure 5. Host tree species influence on the composition of sooty mould community associated with Ultracoelostoma brittini honeydew.
Plot A shows the multidimensional scaling plot based on T-RFLP peak-profiles using Bray-Curtis distances for samples from Lake Rotoiti with grey circles = red beech (n = 5) and black squares = black beech (n = 5); Plot B shows the principle coordinates analyses based on ITS-based pyrosequencing data using weighted Unifrac distances with grey squares = red beech (n = 2) and black circles = black beech (n = 6, sites pooled).

