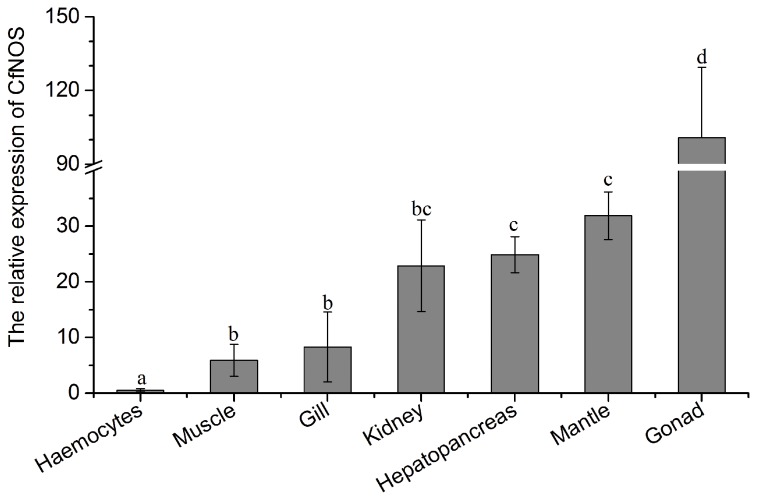
Figure 6. CfNOS mRNA expression levels in multiple scallop tissues detected by real-time PCR.
CfNOS transcript levels in adductor muscle, gill, kidney, hepatopancreas, mantle and gonad are normalized to that of hemocytes. The gene of β-actin was used as internal control to calibrate the cDNA template for all the samples. Vertical bars represents the mean ± SD (N = 6) and bars with different letters were significantly different (P < 0.05).

