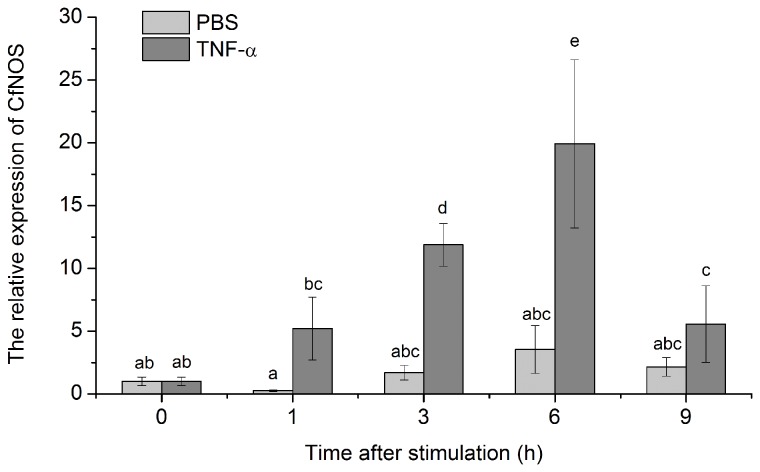
Figure 9. Temporal expression of CfNOS mRNA in scallop haemocytes after TNF-α stimulation.
The samples were collected after the treatments for 1, 3, 6 and 9 h. Data was expressed as the ratio of the CfNOS mRNA to the β-actin mRNA. The scallops injected with PBS were used as the control group. Values were shown as mean ± SD (N = 6) and bars with different letters were significantly different (P < 0.05).

