
Figure 1. Flow cytometry dot plot of activation markers on CD8+ T cells.
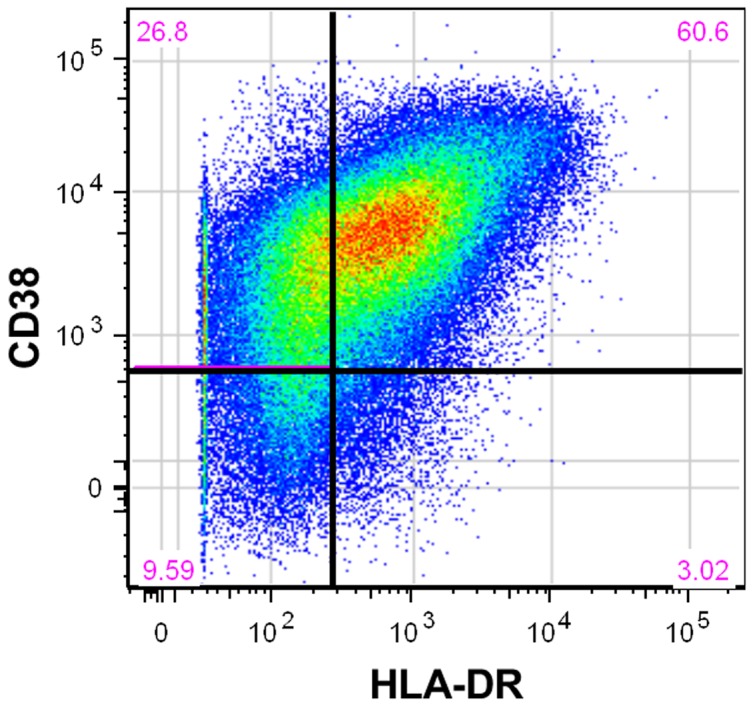
Representative dot plot depicting the use of CD38 and HLADR markers to define activated CD8+ T cell populations. The red numbers in each of corner represent the percentage of CD8+ T cells considered to have each combination of the CD38 and HLA-DR markers. For example, 60.6% of CD8+ T-cells in this plot were classified as being positive for both CD38 and HLA-DR. A similar approach was used with CD4+ T cells.