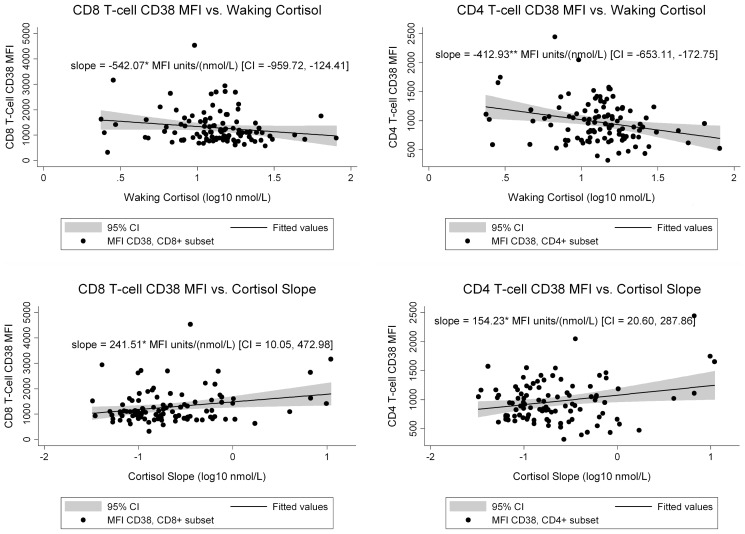
Figure 2. T cell activation as function of diurnal cortisol.
The scatter plots show CD8 and CD4 activation as a function of waking cortisol or diurnal cortisol slope. The slope presented in the graphs is the multivariate regression coefficient for T-cell activation as a function of cortisol measures, adjusted for age, viral load, and CD4 count. Figure 2A shows CD38 mean fluorescent intensity (MFI) on CD8+ T cell in relationship to waking cortisol. Figure 2B shows CD38 mean fluorescent intensity (MFI) on CD4+ T cell in relationship to waking cortisol. Figure 2C shows CD38 mean fluorescent intensity (MFI) on CD8+ T cell in relationship to diurnal cortisol slope. Figure 2D shows CD38 mean fluorescent intensity (MFI) on CD4+ T cell in relationship to diurnal cortisol slope. * = p<.05. ** = p≤.001.

