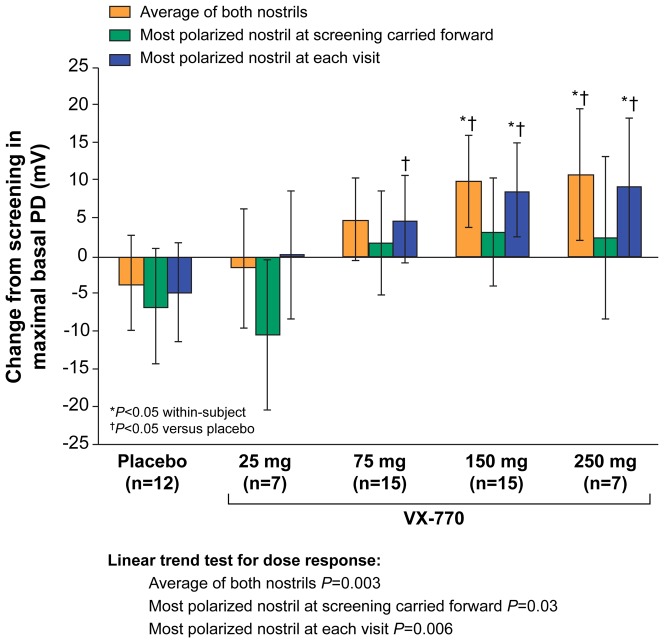
Figure 3. Change from screening to Day 14 in ENaC activity (maximum basal PD, Parts 1 and 2 combined).
Data are shown for the analysis of the average of both nostrils, the most-polarized nostril at screening carried forward, and the most-polarized nostril at each visit. The dose-dependent linear trends were statistically significant for all three analyses (P<0.05).

