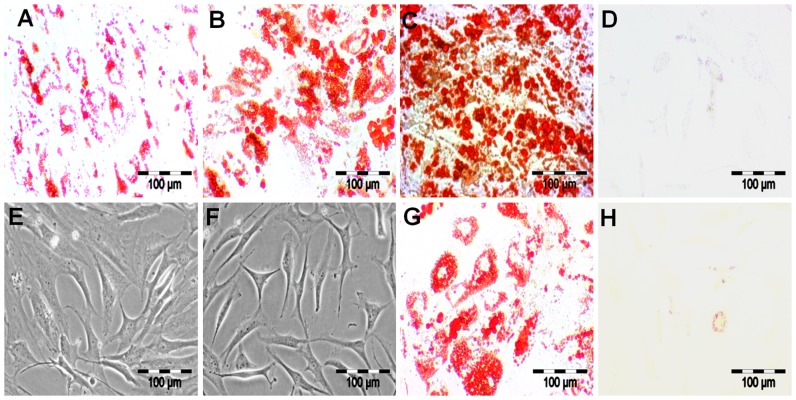
Figure 1. MSC isolation, adipogenic differentiation and dedifferentiation.
MSC were induced to adipogenic differentiation for 15 days. (A) Oil Red O staining showed the formation of lipid droplets on day 5, (B) which increased in size and number, as shown on day 10, and (C) reached a peak value on day 15 of adipogenic differentiation. (D) Control samples showed no lipid formation even after day 15 of adipogenesis. Oil Red O staining during the conversion of adipogenic differentiated cells into dedifferentiated cells showed (G) an intermediate conversion after day 7 and (H) complete conversion after day 35 of reverse adipogenesis. Morphology of (F) dedifferentiated cells and (E) undifferentiated MSC are shown by phase contrast microscopy. Bar: 100 µm.

